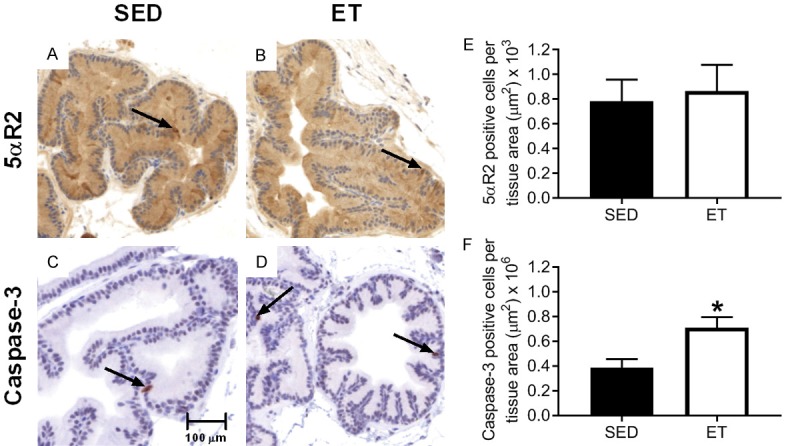
Figure 7.

Representative images of immunohistochemical sections stained for 5αR2 (A and B) and caspase-3 (C and D) in the prostate of SED and ET Copenhagen rats, respectively. The arrows within the tissues are representative stained sections showing 5αR2 and caspase-3 staining. Images were captured at 200X magnification. Bar graph representing prostate 5αR2 (E) and caspase-3 (F) expression between sedentary (SED; n = 10) and exercise-trained (ET; n = 10) Copenhagen rats. No significant difference in 5αR2 between SED and ET groups was observed (P > 0.05). Caspase-3 was significantly increased in ET vs. SED group (*P ≤ 0.05 vs. SED). Values are expressed as mean positive cells per tissue area ± SEM.
