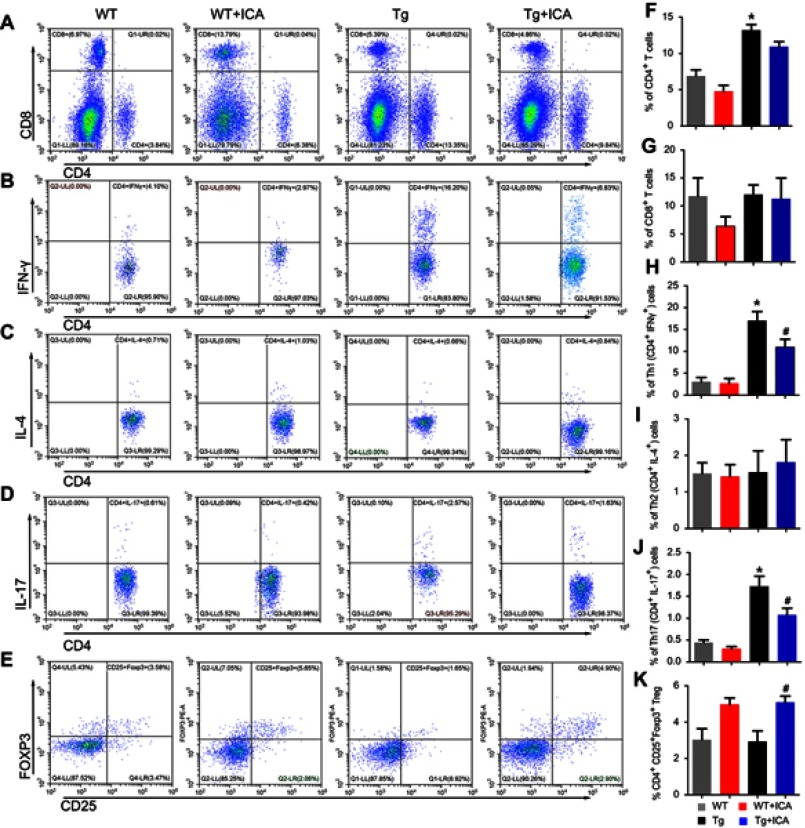
Figure 3.
ICA treatment modulates the differentiation of CD4+ T cells in peripheral blood of APP/PS1 mice. Representative flow cytometry plots gated on T cells: (A) CD4+ T cells and CD8+ T cells; (B) Th1 cells identified by CD4+ and IFN-γ+; (C) Th2 identified by CD4+ and IL-4+; (D) Th17 identified by CD4+ and IL-17+; (E) Tregs identified by CD4+, CD25+ and FOXP3+. Percentages of T cells: (F) CD4+ T cells; (G) CD8+ T cells; (H) Th1 cells; (I) Th2 cells, (J) Th17 cells and (K) Tregs. *P<0.05 compared to WT, #P<0.05 compared to Tg.

