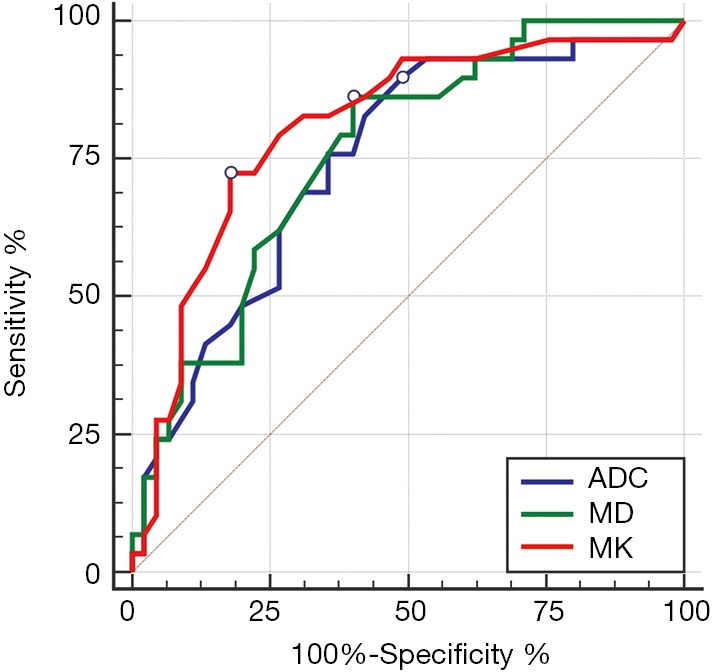
Figure 6.

Comparison of ROC curve analysis of DKI-derived parameters and ADC value of hepatocellular carcinoma for differentiating the low-grade HCC from the high-grade HCC. Graph shows that the AUC was largest for MK (AUC =0.81), followed by MD and ADC (AUC =0.76 and 0.74, respectively). There were no significant differences between the AUCs of each parameter. ADC, apparent diffusion coefficient; MD, mean corrected apparent diffusion coefficient; MK, mean apparent kurtosis coefficient; ROC, the receiver operating characteristics; AUC, area under the ROC curve.
