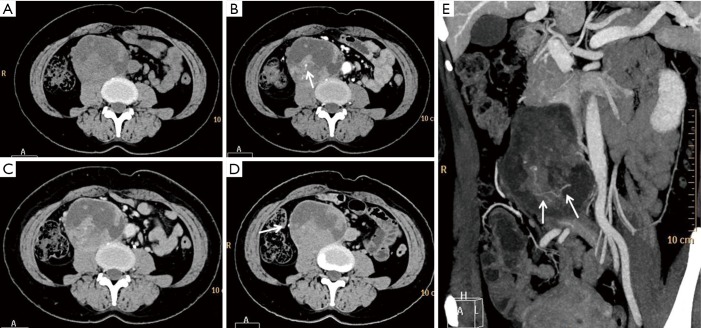
Figure 3.
CT of case3. (A) CT plain image shows a quasi-circular tumor with a capsule and mixed density located on the right side of the aorta with CT value of 40 HU for solid area. There is no distinguishable boundary between tumor and adjacent psoas major muscle; (B) arterial phase image shows solid portions and capsule of the tumor markedly enhanced with CT value increase by 28 HU. The white arrow within solid area indicates an enhanced blood vessel; (C) the enhancement for solid tumor portions slightly decreased with CT value of 65 HU on venous phase; (D) on delay phase, enhancement for solid portions of tumor further decreased and the right ureter is compressed and shifted to the right side (white arrow); (E) MIP image demonstrated tortuous blood vessels within the tumor (white arrows). MIP, maximum intensity projection.

