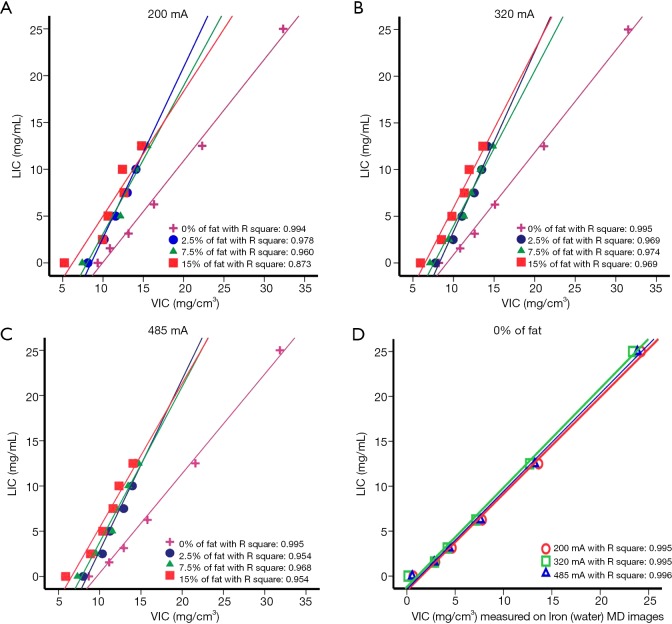
Figure 1.
Scatterplots of liver iron content (LIC) and virtual iron content (VIC) measured by using single source dual-energy CT on iron (fat) MD images for liver-iron phantoms with and without fat at tube currents of 200 (A), 320 (B), and 485 mA (C). The pink, blue, green, and red lines represent the regression lines for the 0%, 2.5%, 7.5%, and 15% of fat samples, respectively. (D) Scatterplots of LIC and VIC measured by using single source dual-energy CT on iron (water) MD images for the fat-free phantom. Spearman correlation coefficients are shown (P<0.05).

