
Figure 3.
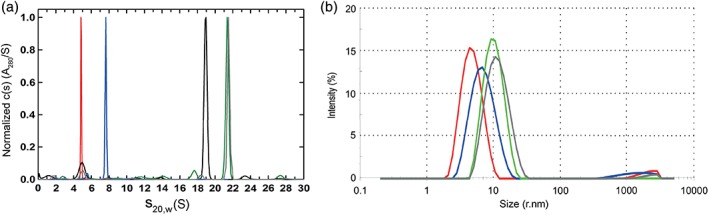
Characterization of CLPA1 and its LF complex by sedimentation velocity and dynamic light scattering. (a) Characterization of PA variant species by analytical ultracentrifugation sedimentation velocity. Normalized absorbance c(s) distributions obtained in SEDFIT. Similar profiles were observed using interference signal. Samples were run in separate cells and profiles overlaid in this single panel, for: PA monomer (red), purified CLPA1 (blue), PA63 + LF heptamer oligomer (black), furin‐cleaved PA‐GN/D512K + LF octamer oligomer (green), and MMP‐ and uPA‐cleaved CLPA1 + LF oligomer (gray). Each sample showed the presence of a single homogenous species. (b) Dynamic light scattering of purified PA variants. As in A, samples were run separately and profiles overlaid for comparison: PA monomer (red), purified CLPA1 (blue), furin‐cleaved PA‐GN and PA‐D512K + LF octamer oligomer (green), and MMP‐ and uPA‐cleaved CLPA1 + LF oligomer (gray). Each sample produced a single homogenous peak, corresponding to radii of 4.9, 7.3, 10.3, and 11.95 nm, respectively. Measurements were made for both experiments at the following concentrations: PA monomer at 0.65 mg/mL, purified CLPA‐1 at 0.61 mg/mL, furin‐cleaved PA‐GN and PA‐D512K + LF octamer oligomer at 0.76 mg/mL, and MMP‐ and uPA‐cleaved CLPA1 + LF oligomer at 0.4 mg/mL.