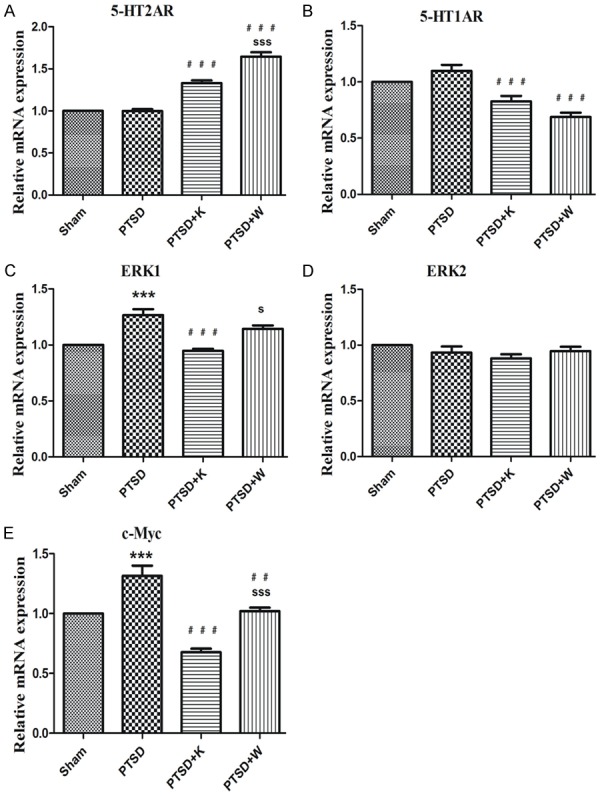
Figure 4.

RT-qPCR showed the mouse hippocampus comparison regarding the relative mRNA expression levels of the 5-HT2A receptor (A), 5-HT1A receptor (B), ERK1 (C), ERK2 (D), and c-Myc (E) to those in the control group. Data were presented as mean ± SEM through ANOVA. Groups were compared by performing Bonferroni’s test, n = 4. ***P < 0.001 vs. the sham group; ##P < 0.01, ###P < 0.001 vs. the PTSD group; sP < 0.05, sssP < 0.001 vs. the PTSD+K group.
