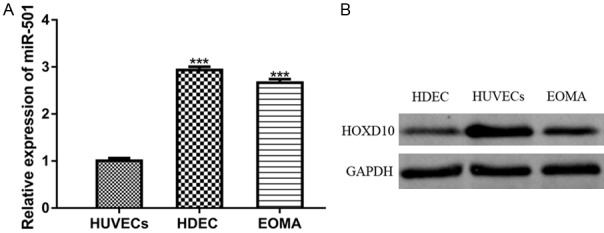
Figure 1.

Expression of miR-501 was upregulated, while HOXD10 expression was downregulated in HA cell lines. (A) Expression of miR-501 in HA cell lines (HDEC and EOM) and HUVECs was analyzed by qRT-PCR analysis. (B) HOXD10 expression in HA cell lines (HDEC and EOM) and HUVECs was analyzed by Western blot analysis. (***P<0.001) miR-501: microRNA-501; HOXD10: homeobox D10; HAs: Hemangiomas; qRT-PCR: quantitative real-time polymerase chain reaction.
