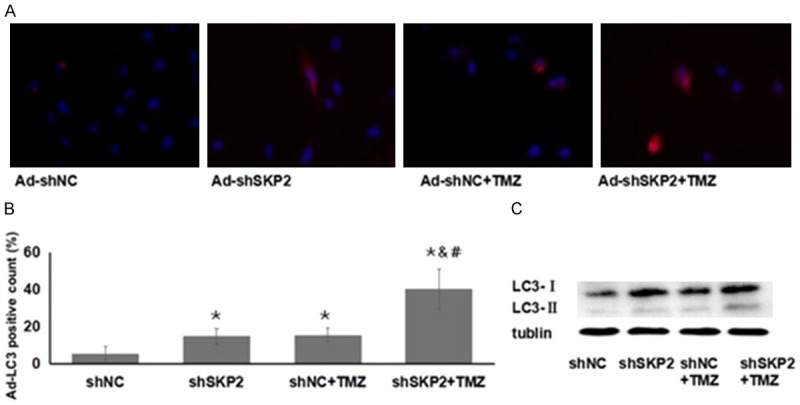
Figure 4.

Effect of Ad-shSKP2 and TMZ on autophagy marker expression was examined. A. The red signal of LC3 of different treatment groups at 48 hour after transduction was examined under the microscope. Red, mRFP of LC3; Blue, DAPI; magnification, × 400. B. The percentage of L3-positive cells in each treatment group was determined and compared. *P < 0.05 compared to shNC group; #P < 0.05 compared to shNC+TMZ. C. The up-regulation of LC3-II by the combined treatment of shSKP2 and TMZ was examined using Western blotting assays. Shown is the representative set of data from 3 independent experiments.
