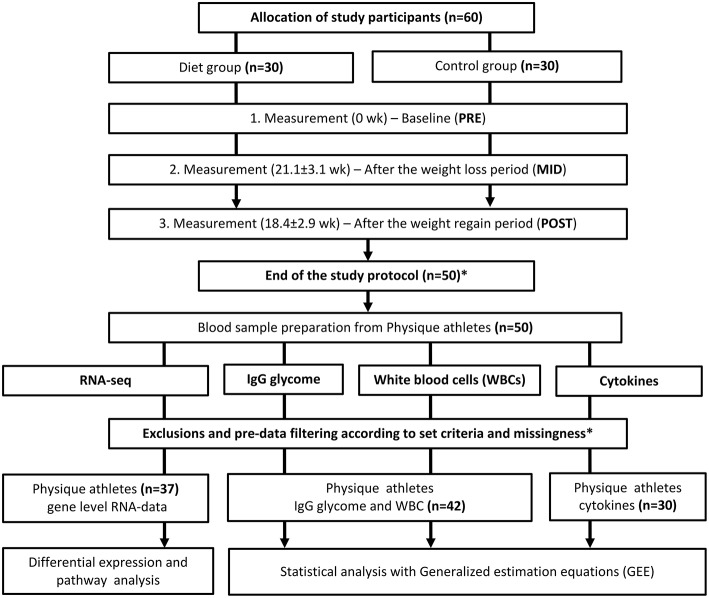
Figure 1.
Study design and workflow. Study design and workflow are represented in a flowchart to illustrate the whole study protocol used. *Of the 60 participants who started the study, 10 failed to complete the study regimen in a required manner. One control did not arrive for baseline testing (PRE) and the remaining nine participants (three from the diet group and six controls) were excluded out of the study because of a short duration of the weight regain period compared with the other participants or failure to completely follow the study instructions. Additional participants that lacked complete dietary records (n = 8) were excluded from the current omics study. Due to the high cost of large-scale data-set quantification, only individuals with minimal missing information were included in the study sample. After data quality control, also additional individuals were excluded from the analysis. The final number of participants used for the analysis on each data set is depicted in the figure. In total, we included samples from 42 participants (diet group n = 25, control group n = 17) in the bioinformatic analysis after the relevant exclusions. For the cytokine profile quantification, samples from only 30 individuals were analyzed due to high-cost of the analysis panel. Furthermore, sample size varied slightly between different downstream analyses due to incompleteness of omics or phenotype data.

