Figure 2.
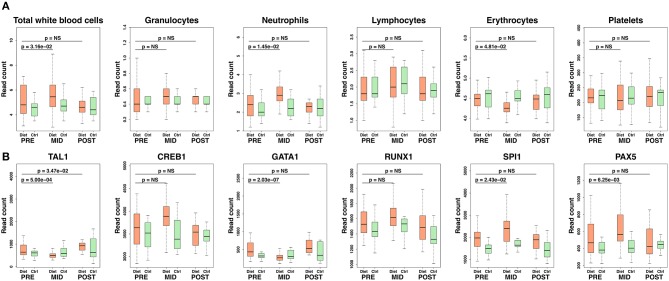
Transcription regulators of hematopoiesis and blood cell count alteration following intense weight loss. Here, we demonstrate alterations occurring in hematopoiesis regulation and subsequent changes in circulating blood cells. In particular, suppressed differentiation in erythroid lineage and induced activity of leukocyte progenitor cell lines (myeloid, lymphoid) were suggested by increased SPI1 and reduced GATA transcription factor expression levels. Panel (A) depicts absolute levels of different categories of quantified blood cells, whereas panel (B) demonstrates downstream modulation of transcription factors affecting blood cell formation. Ctrl, control; NS, not significant (P > 0.05 on panel (A), false discovery rate, FDR > 0.05 on panel (B). Granulocytes depicted in the figure include basophils, eosinophils, and monocytes (i.e., mixed cells). Box-plot elements are defined as follows: center line, median; box limits, upper and lower quartiles; whiskers, 1.5× interquartile range.

