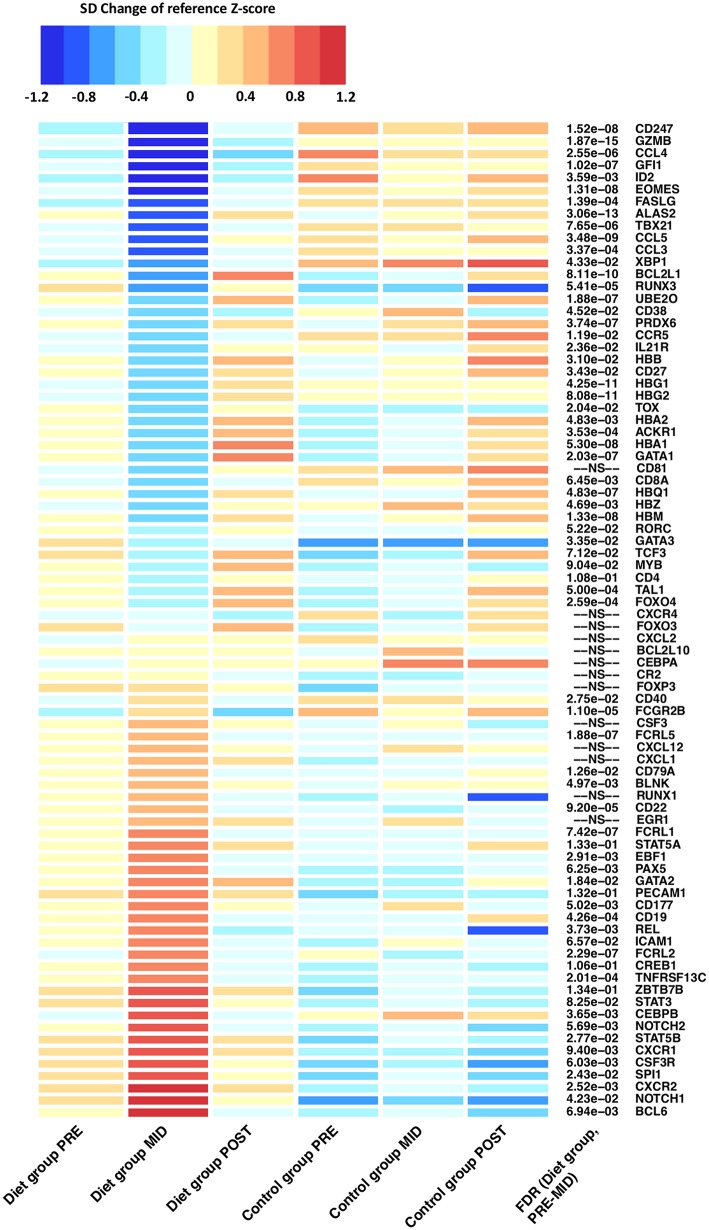
Figure 3.
Differentially expressed genes related to innate and adaptive immune system function after the prolonged period of low-energy availability. Heat map of differentially expressed genes depicts alteration in RNA expression levels that belong to immune function related pathways after the weight loss period when compared with controls (PRE–MID). Heat map is derived from DESeq2 normalized expression levels (read counts) that are represented as standard deviation (SD) change from the reference Z-score. The baseline calculated Z-score values (PRE) from both the diet and control groups were pooled together and set as the reference level to which each individual group/time-point level was compared. On the heat map, blue colors indicate decrease and red colors increase in gene expression level compared with the calculated reference value. FDR = false discovery rate. Adjusted P-values are represented in front of each HGNC gene symbol name. FDR > 0.2 was set as not significant (NS).

