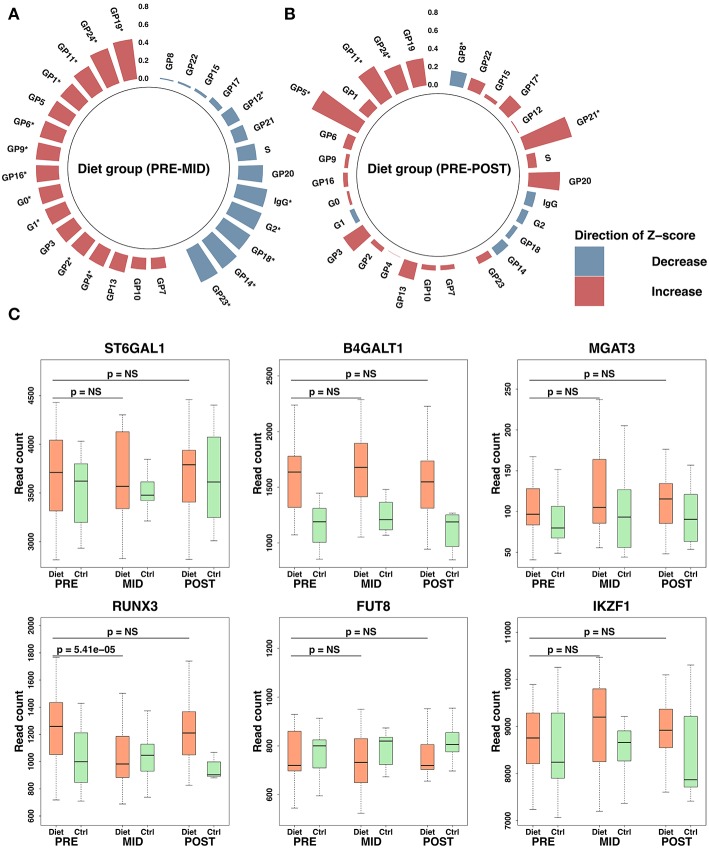
Figure 4.
Immunoglobulin G (IgG) glycosylation peak modulation and expression changes in associated transcriptomic regulators after the intense weight loss period. Overall, this figure shows IgG glycosylation changes in the diet group during the study. Polar plots are derived from IgG glycosylation peak raw values where outliers based on four standard deviations (SDs) from the mean have been excluded. Plotted values are represented as SD change from the set reference Z-score. Red color indicates increase and blue a decrease compared with the reference Z-score. Height of the bars depicts the Z-score level, and the scale is plotted on the figure vertically. Significant time-dependent changes are assigned on the figure with an asterisk (*). IgG glycosylation peaks are ordered based on panel (A) for the diet group. Z-score reference values for the diet group were determined from the baseline values. Panels (A,B) demonstrate diet group IgG glycosylation changes after the weight loss period (panel A, PRE–MID) and after the whole study period (panel B, PRE–POST). Panel (C) demonstrates expression levels observed in transcription factors associated with IgG glycosylation. P-values in panel (C) have been adjusted for multiple testing by using false discovery rate (FDR). Significance threshold was set to FDR < 0.05. Box-plot elements are defined as follows: center line, median; box limits, upper, and lower quartiles; whiskers, 1.5 × interquartile range.

