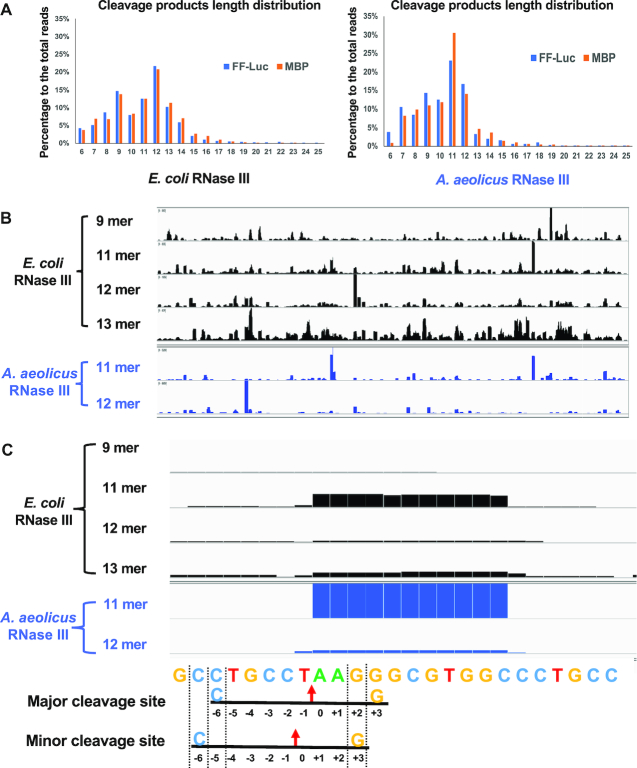
Figure 5.
Bacterial RNase III cleaves dsRNA into small RNAs with distinct patterns of length distribution. (A) The length of RNase III cleavage products was measured by the next-generation sequencing analysis. The percentage of reads with certain length to total number of reads was plotted. (B) Cleavage products of FF-luc dsRNA were mapped back to the reference. Coverage plots of reads with certain length are presented. (C) A detailed look of one hotspot. The height of the bar represents the number of cleavage products covering each position. The reference sequence is listed below. Two potential cleavages are indicated: red arrows point to the cleavage sites; +3G (yellow) and -6C (blue) corresponding to each cleavage site are labeled.

