Figure 5.

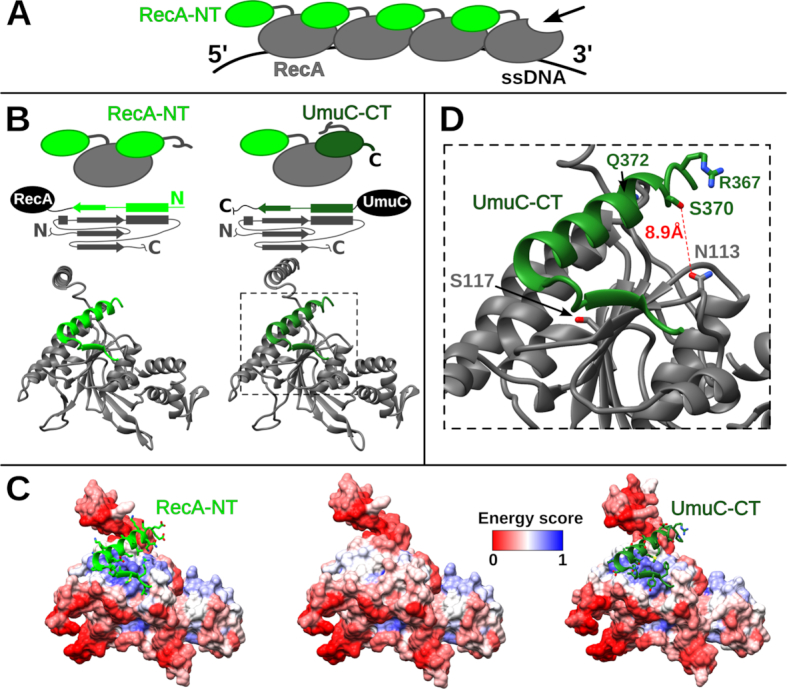
Comparison of Escherichia coli RecA-NT and UmuC-CT complexes with RecA. (A) Schematic representation of RecA filament on ssDNA. Arrow indicates the only free interaction site on the RecA surface at the 3′-end of RecA filament. (B) Schematic and structural comparison of the two complexes. (C) Interface energetic scores depicted as colored surfaces for RecA bound to RecA-NT (left), not bound to any motif (middle) and bound to UmuC-CT (right). Blue and red colors correspond to estimated favorable-unfavorable surface energy. (D) Zoomed-in interaction interface between E. coli UmuC-CT and RecA. The corresponding part of the structure is indicated with a dashed line in part (B). UmuC-CT residues S370, R367 and Q372 that have been shown to crosslink to the RecA position 113 are highlighted. The RecA S117 residue located at the interface is also highlighted.
