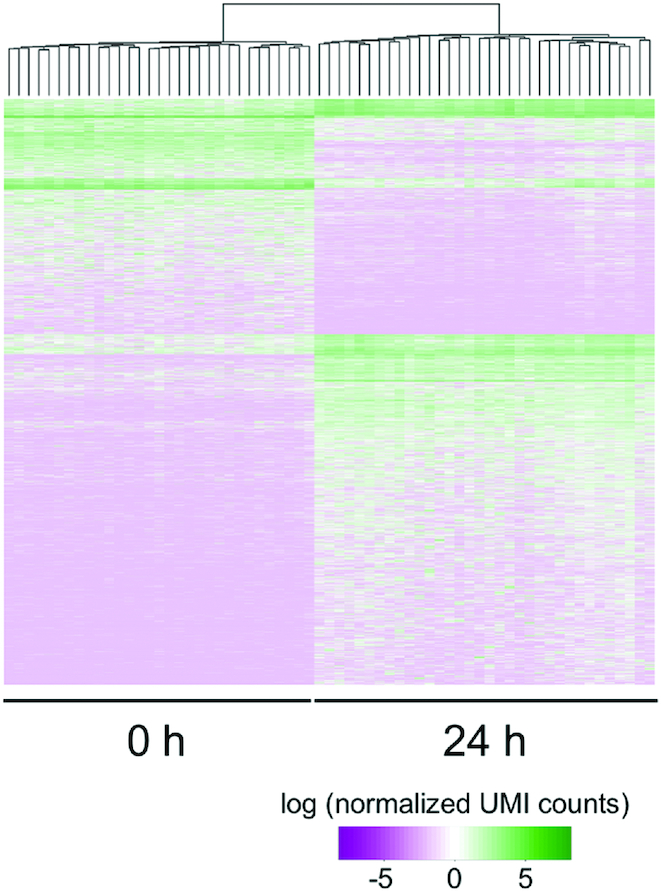
Figure 2.

Hierarchical clustering of differentially expressed genes (DEGs) in individual cells at 0 and 24 h after leaf excision. Using 1cell-DGE data taken from 31 and 34 cells at 0 and 24 h after leaf excision, respectively, 6,382 genes were identified as DEGs (FDR < 0.01) after normalization with iDEGES using the TCC package (32). Of these, 2382 and 4000 were more highly expressed in the cells at 0 and 24 h, respectively. Hierarchal clustering was performed using hclust in the stats package. The colored bars indicate the normalized UMI counts as the expression levels of the DEGs on a log scale.
