
Figure 8.
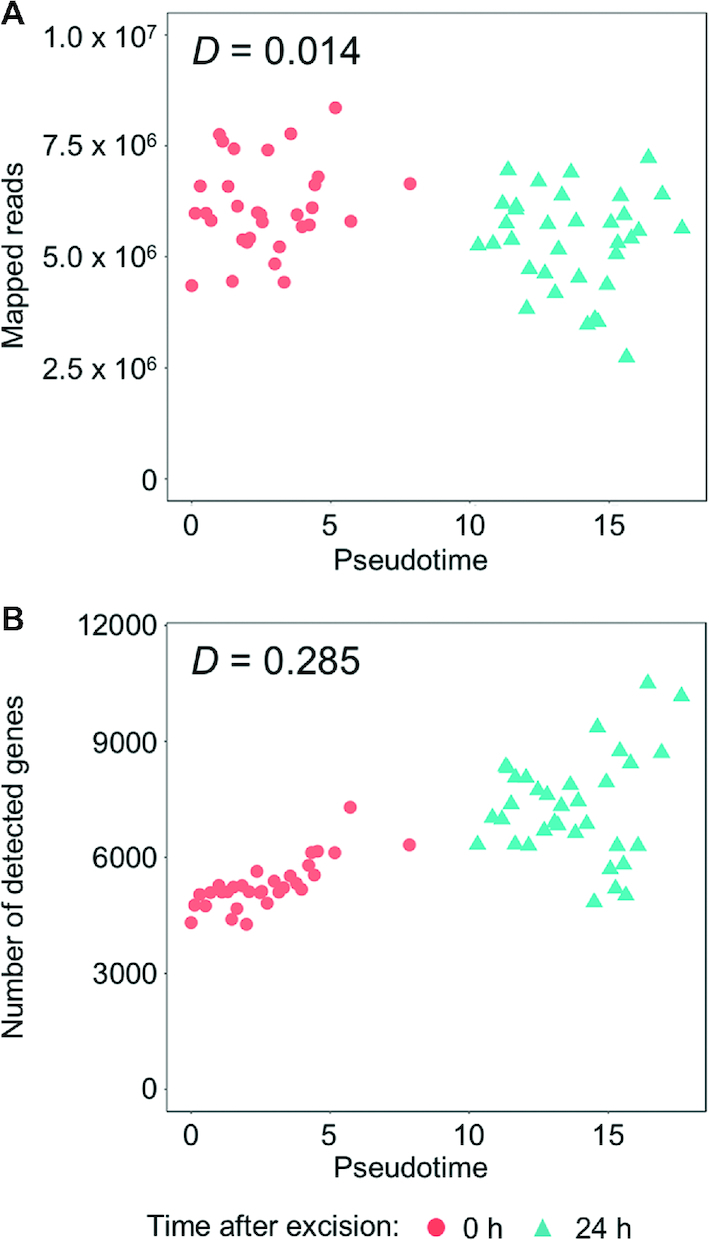
Correlation between pseudotime and NGS statistics. The pseudotimes of the 1cell-DGE data were plotted against (A) the mapped read counts and (B) the numbers of detected genes. Each dot indicates an independent cell categorized by the time it was sampled after the leaf excision. D indicates the statistical values calculated using Hoeffding's D test of independence in the Hmisc package (37).