Figure 3.
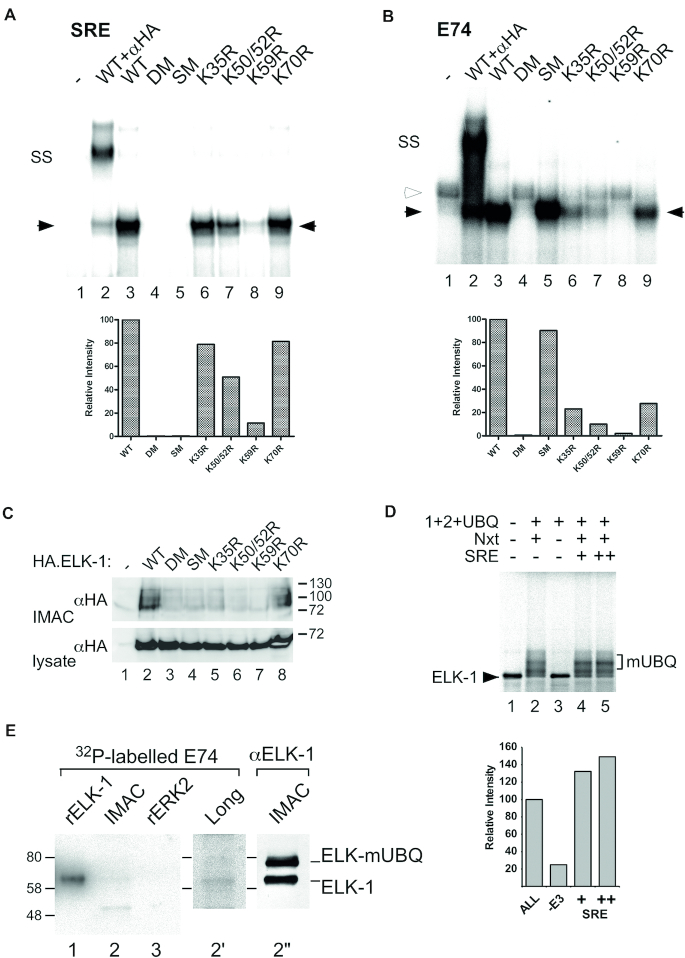
ELK-1 mono-ubiquitination requires ternary complex formation but blocks DNA binding. (A) HA.ELK-1 and mutant proteins indicated were incubated with a radio-labelled SRE probe and recombinant coreSRF. Complexes were resolved by electrophoresis and visualized by phosphor-imaging. Solid arrowheads indicate ELK-1/E74 complexes; SS indicates super-shift obtained with anti-HA antibody (lane 2). Histogram (below) shows densitometric analysis of ELK-1/DNA complexes (solid arrows) in lanes 3–9 with ELK-1 set at 100%. (B) As in (A) except that complexes were formed with a radio-labelled E74 probe; open arrowhead indicates non-specific band seen in WCE from control cells (lane 1). (C) WCEs from HEK293 cells transfected with expression vectors for His.Tyg.UBQ and HA.ELK-1 or mutants indicated were subjected to IMAC. Isolated proteins were analysed by SDS-PAGE (7.5%) and immunoblotting with an anti-HA antibody. Lower panel: WCEs analysed for ELK-1 expression. (D) 35S-labelled ELK-1 was incubated alone (lane 1), with E1, E2, UBQ and UA (lanes 2–5) and with or without Nxt and an SRE oligonucleotide duplex as indicated. Reactions were separated by SDS-PAGE (7.5%) and analysed by phosphor imaging. Bracket indicates ELK-mUBQ species. Histogram (right) shows densitometry of mono-ubiquitinated species in lanes 2–5 with lane 2 set at 100%. (E) Lysate from HEK293T cells transfected with expression vectors for His.UBQ(L73P) and HA.ELK-1 was subjected to IMAC. Recombinant ELK-1, ERK2 (Supplementary Figure S5) and IMAC samples were separated by SDS-PAGE (5–20%) transferred to nitrocellulose, renatured and incubated with radio-labelled E74 probe. Lane 2′ shows longer exposure of lane 2. ELK-1 and ELK-mUBQ presence in IMAC sample was confirmed by immunoblotting with anti-HA antibody (lane 2′′).

