Figure 2.

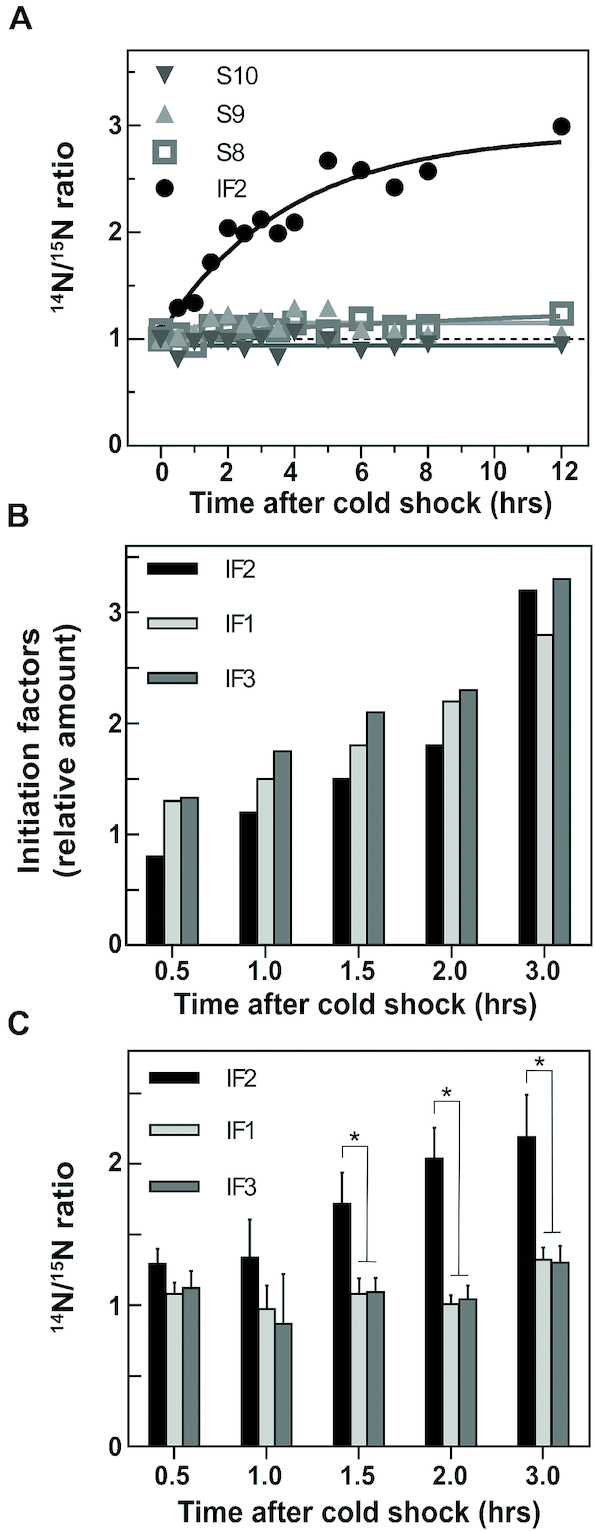
Level of initiation factors and ribosomal proteins associated with the ribosomal subunits during cold acclimation. (A) Variation, as a function of the time elapsed after cold stress (37°C →10°C), of the levels of IF2 (•), S8 (□), S9 (▵) and S10 (▿) associated with the peak of the 30S ribosomal subunits resolved by sucrose density gradient centrifugation. The relative protein levels after the cold stress were determined from the 14N/15N ratios taking the ratio recorded just before the stress as = 1; (B) variation of the relative cellular levels of IF1 (light grey bars), IF2 (black bars) and IF3 (dark grey bars) with respect to the amount of ribosomes as a function of the hours elapsed after cold shock. The protein levels, determined by western blotting are normalized taking the levels detected before the stress as = 1. This experiment is described in detail in (13) from which the panel is taken after some modifications and is shown here only to emphasize the difference between total level of free IFs in the cell and their levels in association with the ribosomes; (C) variation as a function of the hours elapsed after cold shock of the14N/15N ratios determined for IF1 (light grey bars), IF2 (black bars) and IF3 (dark gray bars) found in association with the 30S subunits. The levels detected before the stress are taken as being = 1. The standard deviation for each protein was measured using the respective pool of peptide ratio measurements. *P ≤ 0.001 (ANOVA test, IF2 versus IF1 or IF3, was performed using average ratio, standard deviation and number of identified peptides of each protein).
