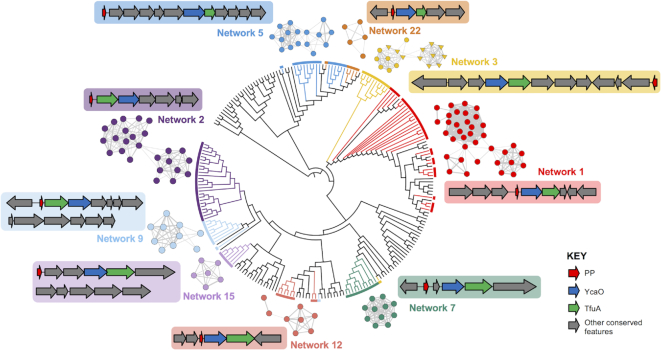
Figure 4.
Examples of putative RiPP BGCs and associated TfuA phylogeny. A maximum likelihood tree (branch lengths removed) of TfuA-like proteins is color-coded to indicate the relationship between TfuA-like proteins and the associated networks of putative precursor peptides. Representative BGCs are also shown, where grey genes indicate genetic features that are conserved across multiple BGCs within that family. Fully annotated BGCs are shown in Supplementary Figures S7–S20.

