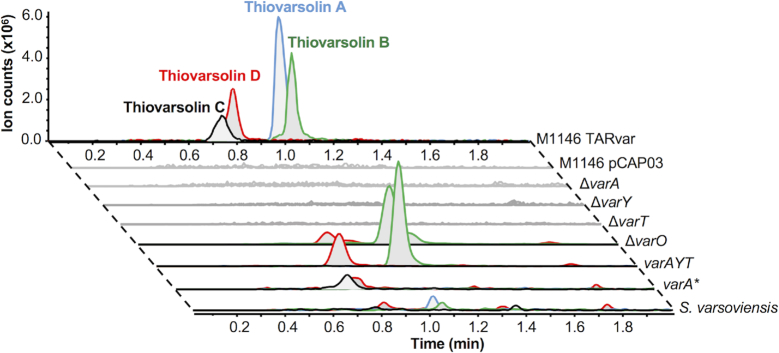
Figure 6.
Mutational analysis of thiovarsolin biosynthesis. Extracted ion chromatograms (EICs) are shown for each thiovarsolin (A = m/z 399.18, B = m/z 401.20, C = m/z 385.16, D = m/z 387.18). M1146 pCAP03 indicates the empty plasmid control, while each Δvar mutation was made in the TARvar construct and expressed in S. coelicolor M1146. See text and Supplementary Figure S36 for details of varA*.

