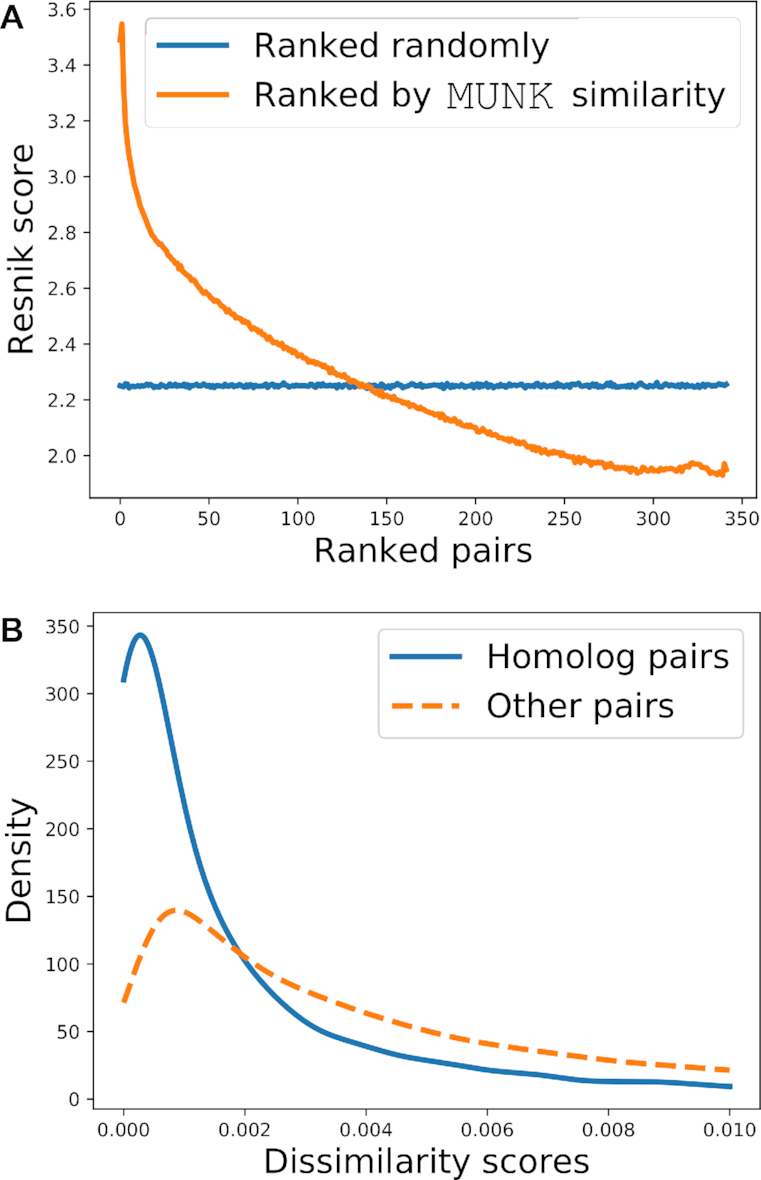
Figure 2.

The relationship between MUNK similarity scores and functional similarity for the human (source) to mouse (target) embeddings. (A) Relationship between functional similarity measured by Resnik score (y-axis) and protein pairs ranked (x-axis) by MUNK similarity (shown in orange) and ranked randomly (shown in blue; included as a baseline). (B) Distribution of MUNK dissimilarity scores for homologous protein pairs compared to distribution for other (non-homologous) protein pairs.
