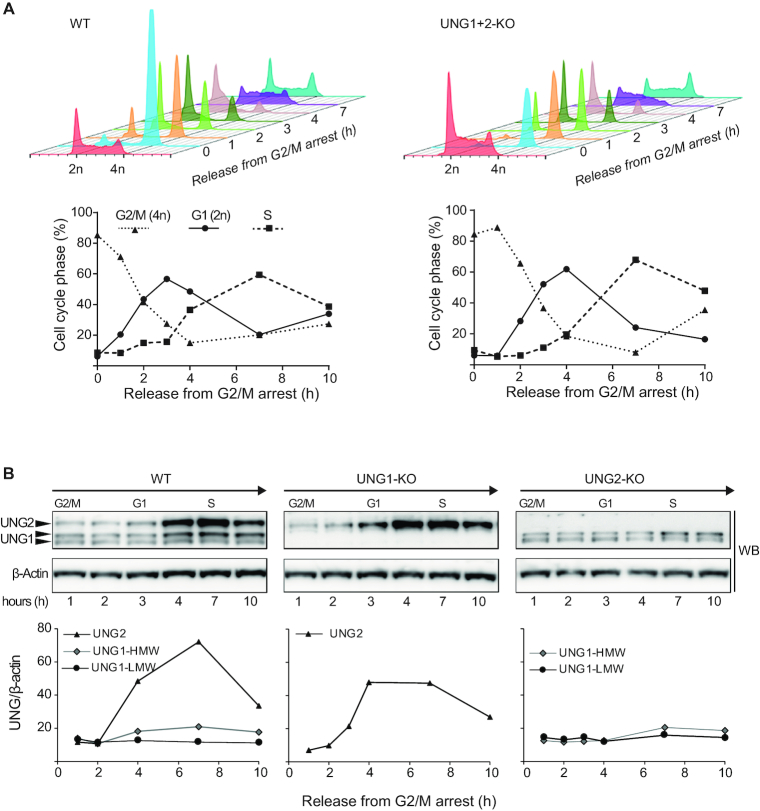
Figure 2.
Cell cycle regulation of UNG1 and UNG2 in CH12F3 cells. (A) Cell cycle synchronization of WT and UNG1/UNG2-KO CH12F3 cells. Cells were arrested in G2/M using the ATP-competitive CDK1/cyclin B1 inhibitor RO-3306 and cell cycle distributions were analyzed by FACS at several time points after release (upper panels). For comparison, cell cycle histograms of unsynchronized cells are shown in red (in front). The fraction (%) of cells in each phase of the cell cycle at several time points after release from G2/M arrest is illustrated below the histograms. (B) Relative level of UNG1 and UNG2 isoforms during the cell cycle. Cells were harvested at several time points after release from G2/M arrest. UNG isoforms in WT and isoform-specific KO cells were analyzed by western blot on whole cell extracts (upper panel) and quantified relative to β-actin (lower panels). The two UNG1 variants (UNG1-HMW and UNG1-LMW) were quantified separately.

