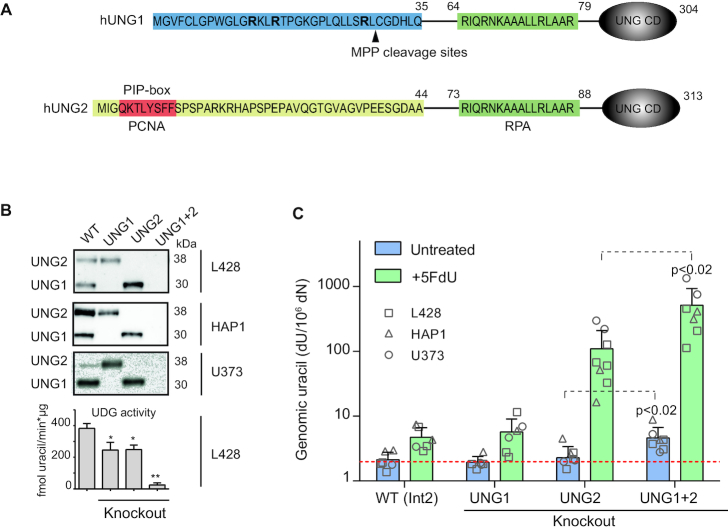
Figure 7.
Generation and characterization of UNG isoform-specific human cell line clones. (A) N-terminal amino acid sequence of human UNG1 and UNG2. UNG1-specific residues (amino acid 1–35) are marked in blue. Arginine (R) residues in bold and target site for proteolytic processing by MPP (mitochondrial processing peptidase) are indicated. UNG2-specific residues (amino acid 1–44) are yellow, and include the PIP-box in red. The common RPA-binding site (green) and the globular catalytic domain (UNG CD) are indicated. (B) Representative CRISPR/Cas9 UNG isoform-specific knockout clones generated in three human cell lines (L428, HAP1, U373). Clones were screened by western blot analysis and UDG activity assays on whole cell extracts. High molecular weight 3H-U:A nick-translated DNA was used as substrate. The bars represent mean activity of three independent L428 clones. Significantly reduced UDG activity compared to WT (UNG Int2) is indicated with *P< 0.05 or **P< 0.005. (C) Genomic uracil levels in untreated and 5FdU-treated UNG isoform-specific knockout clones. Cells were seeded (0.2 × 10⁻⁶ cells/ml) 24 h before the addition of 1 μM 5FdU. Cells were harvested 24 h post treatment. dU was quantified by LC–MS/MS. Bars represent the mean value of six to eight different clones in each group (indicated). Red dotted line indicates dU level in UNG-treated DNA (detection limit). Significantly increased dU levels in the UNG1+2 knockout group compared to the UNG2 knockouts are indicated with P-values.

