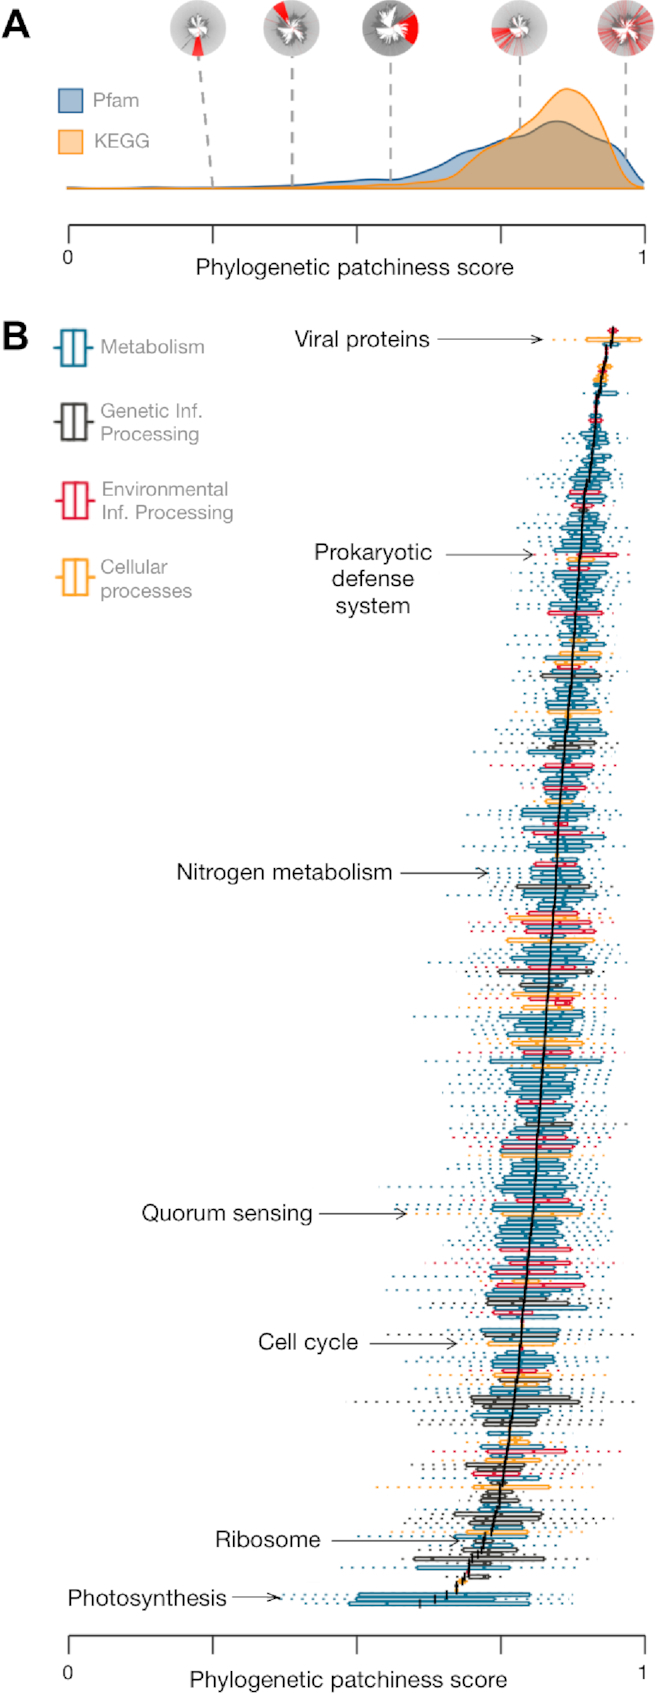
Figure 3.

Phylogenetic patchiness of annotations inferred using AnnoTree. Phylogenetic patchiness was computed for each KEGG KO identifier and Pfam protein family using the consistency index (CI), a common homoplasy metric representing the inverse of the minimum possible number of state changes (trait gain or loss) given the tree topology. The final phylogenetic patchiness score is equal to -log(CI)/log(family size) where family size is the total number of genomes containing the trait. (A) Density plot showing the distribution of phylogenetic patchiness scores of Pfam protein families and KO identifiers with different visual examples of varying patchiness (red = present; gray = absent). The phylogenetic distribution plots are, from left to right: K10922 (transmembrane regulatory protein ToxS), K18955 (WhiB transcriptional regulator), PF01848 (ATP12 chaperone), PF01848 (Hok/Sok antitoxin system), and K07495 (putative transposase). (B) Mean-sorted box plots containing phylogenetic patchiness scores of KO identifiers in their respective KEGG pathways and KEGG BRITE categories. The mean patchiness score of a set of KO identifiers in a KEGG pathway or KEGG BRITE category is indicated by a black line.
