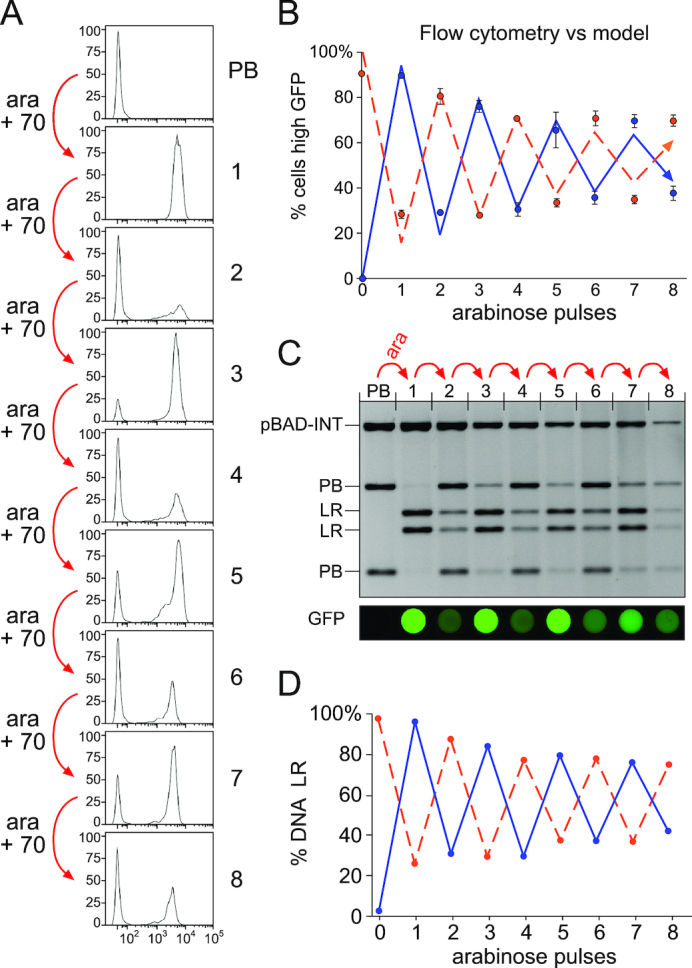
Figure 8.

Repeated operation of pSWITCH3* allowing 70 generations for plasmid segregation between arabinose pulses. (A) Cells containing pBAD-INT and pSWITCH3*-PB were exposed to eight arabinose pulses, each pulse followed by 70 generations to allow almost complete plasmid segregation. Histograms show fluorescence of ∼30 000 cells measured by flow cytometry after each pulse and 70 generations of growth. (B) Graph showing results of three repeats of the same experiment, starting from either pSWITCH3*-PB (blue circles) or pSWITCH3*-LR (orange circles). The percentage of cells with high GFP fluorescence is plotted. Values are the average from three replicates, and error bars represent the standard deviation. Lines show predictions from a model in which 95% of all cells in the PB state change to LR, and 85% of all cells in the LR state change to PB at each pulse. (C) Plasmid DNA was isolated from the samples shown in (A), cleaved with SpeI and analysed by agarose gel electrophoresis. Fluorescence scans of 200 μl of cell culture at each stage are shown aligned with the corresponding lanes of the gel above. (D) Quantitation of DNA in PB and LR states, starting from either PB (blue line) or LR (orange dashed line).
