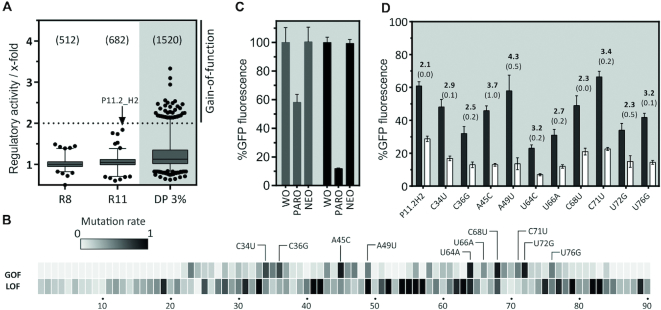
Figure 3.
In vivo screening for PARO riboswitches and development of the paromomycin riboswitch. (A) The boxplot displays regulation factors of the candidates identified by in vivo screening, the total number of candidates analysed in brackets. The analysis was done with the SELEX pool of rounds 8 and 11 and a doped pool of candidate P11.2H2 (DP 3%). The candidate P11.2H2 we found in the pool of round 11 is highlighted. Note that the other two candidates with ∼1.7-fold regulation proved to be false positives. (B) A doped pool of candidate (3% mutation rate) was screened for mutants with a gain- and loss-of-function phenotype (GOF and LOF, respectively). The heat map represents the frequency of GOF and LOF mutations found in every position amongst the 100 strongest GOF and 200 LOF candidates. Most frequent mutations are highlighted. (C) Comparison of the PARO riboswitch (PARO-RS, black bars) with the originally identified candidate P11.2H2 (grey bars). Displayed is the GFP expression in the absence and presence of 250 μM PARO and NEO, respectively. The results were normalized to GFP expression without ligand set as 100%. The error bars represent standard deviations amongst triplicates; the measurement was repeated at least twice. (D) Summary of the 10 most frequent GOF mutations. The GFP expression level was measured in the absence (black bars) and presence of 250 μM PARO (white bars), the mean regulation factor and the standard deviation are displayed above the bars. The measurements were done in triplicates and repeated twice.

