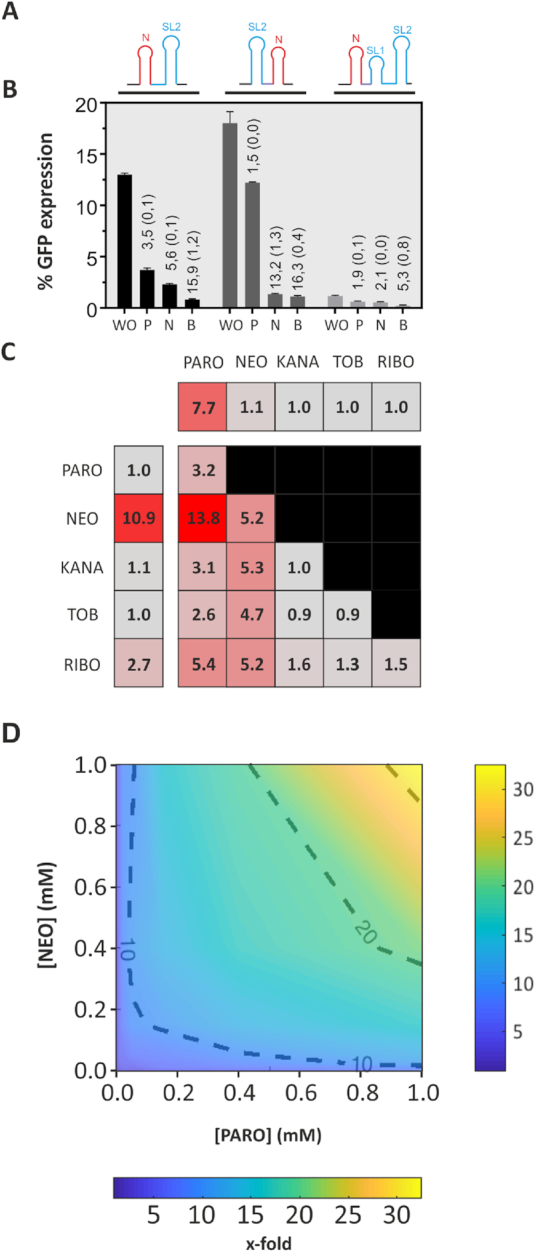
Figure 6.

Engineering of an NOR Boolean Logic gate. (A) Representation of the construct NEO-PARO (I), PARO-NEO (II) and NEO-full PARO (III). The neomycin riboswitch (N) is represented in red. The paromomycin riboswitch containing the first stem loop (SL1) and second stem loop (SL2) in blue. A CAA spacer region was sometimes introduced and is represented in purple. All these construct were inserted in front of the GFP gene. (B) Comparison of the GFP expression of three tandem constructs NEO-PARO (black), PARO-NEO (dark grey) and NEO-full PARO (light grey): Experiment was made either without ligand (WO), with 250 μM PARO (P), with 250 μM NEO (N) or with 250 μM of both antibiotic (B). (C) Heat map of the switching factor of the PARO-RS (first line), the NEO-RS (first column) and the logic gate NEO-PARO. Both riboswitches were tested against 250 μM of each of these antibiotics. For the PARO switch, only PARO triggered the switch. However, for NEO, RIBO is also able to slightly trigger the switch. The logic gate NEO-PARO was tested against each five antibiotics previously tested, but as well on all the combination of two different antibiotics at 250 μM each. The lower the switching factor is, the more the colour of the square will turn grey. As expected, the NEO-PARO shows the best switching factor when the combination of both NEO and PARO are added to the media. (D) Dose–response experiment of the NEO-PARO construct in function of the PARO and NEO concentration. The darker blue the colour is, the lower the switching factor is. The redder, the higher is the regulatory activity. Results between each measured concentrations were interpolated.
