
Figure 3.
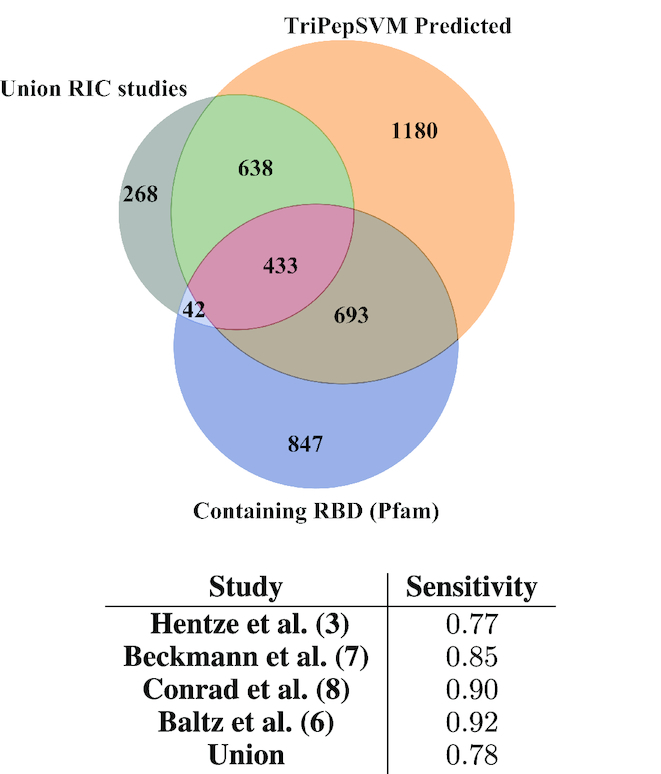
Overlap between four different interactome capture studies and predictions from TriPepSVM.We computed the overlap between our proteome-wide predictions (orange, top right), the union of identified proteins from four independent RIC studies (gray, top left) and proteins containing RBDs according to the Pfam database (blue, bottom). The table shows the sensitivity between our predictions and the four different RIC studies and their union.