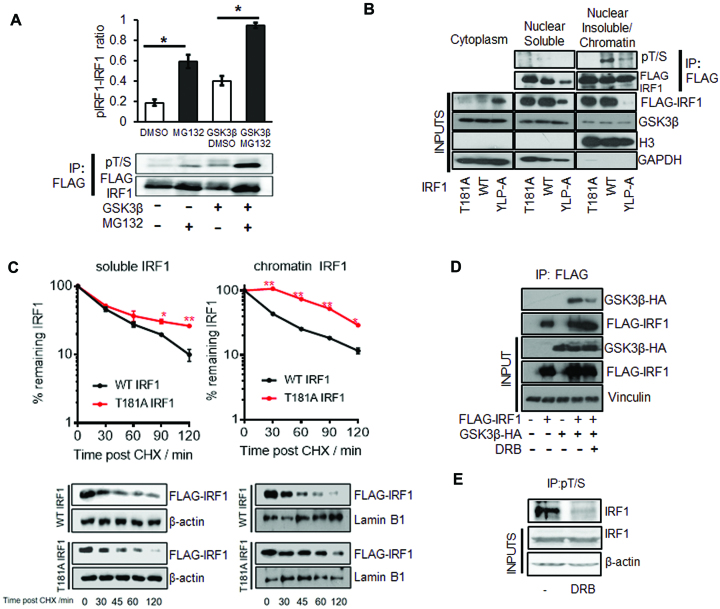
Figure 8.
IRF1 phosphorylated at T181/S185 is linked to transcription and degradation. (A) HEK293 cells expressing FLAG-IRF1 with GSK3β-HA or empty vector were treated with 10 μM MG132 or DMSO for 6 hr prior to lysis. Following immunoprecipitation with anti-FLAG beads, western blots were performed using the anti-pT/S antibody and re-probed with anti-FLAG to determine total IRF1 protein, and a representative blot is shown. The ratio phospho-IRF1 to total IRF1 was quantified by densitometry, and data from three independent experiments are shown. Error bars denote SEM and * indicates P>0.05 by Students t-test. (B) Extracts from HEK293 cells expressing WT, T181A or YLP-A IRF1 proteins were separated into cytoplasmic, nuclear and chromatin fractions. Nuclear and chromatin lysates were immunoprecipitated with anti-FLAG after adjustment for IRF1 expression levels and blotted with the anti-pT/S antibody. Lower panels show expression of IRF1 mutants in fractions and GAPDH as a cytoplasmic marker and Histone H3 as a chromatin marker. (C) HEK293 cells expressing WT or T181A IRF1 were CHX chased for indicated times, lysates were prepared in 200 mM NaCl buffer (nuclear soluble) and insoluble pellets (chromatin) were further digested by incubation in 500 mM NaCl buffer supplemented with DNase I. The two separated fractions were probed for FLAG-IRF1. Panel below shows western blots related to panels above, β-actin was used as a soluble and Lamin B1 as an insoluble loading control. Statistical difference is between WT and T181A IRF1. (D) HEK293 cells expressing FLAG-IRF1 and GSK3β-HA for 48 hr were treated with DRB (1 μM/1 h) prior to lysis and immunoprecipitation with FLAG. Inputs are shown below. (E) H3396 cells were pre-treated with DRB (1 μM/1 h) to inhibit transcription prior to immunoprecipitation with pT/S and blot with IRF1 antibody.

