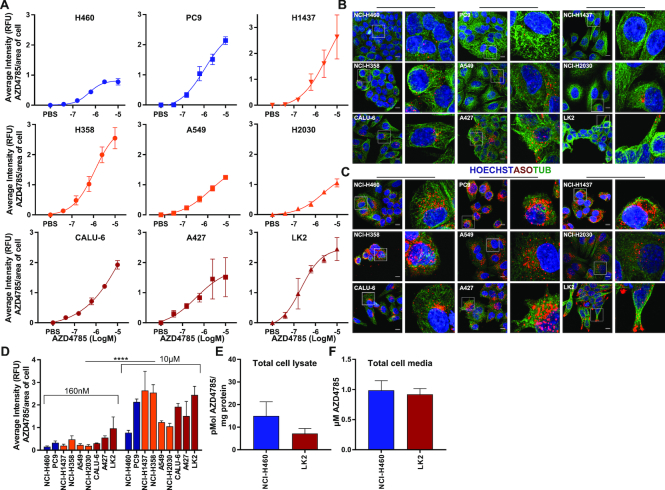
Figure 2.
Quantification, intracellular distribution and accumulation of cEt-ASO across NSCLC cell lines. (A) Cell lines were seeded onto glass-bottomed plates and treated with a dose range of AZD4785 or PBS. Cells were fixed at 72 h and nuclei stained with Hoechst, cytoskeleton with alpha-tubulin and AZD4785 with an antibody that recognizes the phosphorothioate backbone of the antisense drug (anti-ASO antibody). Images were acquired and analysed using Columbus software. Hoechst was used to define the cell nucleus and alpha-tubulin and anti-ASO antibody to define the cell cytoplasm for Columbus analysis. Relative AZD4785 fluorescence (RFU) was quantified per object (cell) over 16 fields of view per well background corrected and normalized to the calculated average cell area of each cell line. Data were analysed from a minimum of three experiments, error bars represent standard error of the mean (SEM). (B and C) Representative images taken from NSCLC cells treated with (B) 160 nM or (C) 10 μM of AZD4785 for 72 h. Images were acquired and processed using FIJI (ImageJ) software; scale bar is 10 μm. (D) Relative ASO fluorescence was quantified over 16 fields of view per well and normalized to the average cell area of each cell line as previously described. Data were analysed from a minimum of three experiments, error bars represent SEM. Results showed significant increase in immunofluorescence between 160 nM and 10 μM dosing groups (t-test, P<0.001 (****)). (E) Mass spectrometry was carried out on lysates from LK2 and NCI-H460 cells dosed with 10 μM AZD4785 for 72 h to determine quantification of intact cellular ASO. Data were analysed from three independent experiments, error bars represent SEM. (F) Mass spectrometry was carried out on cell culture media from LK2 and NCI-H460 cell lines dosed with 10 μM AZD4785 for 72 h. Data were analysed from three independent experiments, error bars represent SEM.

