Figure 4.
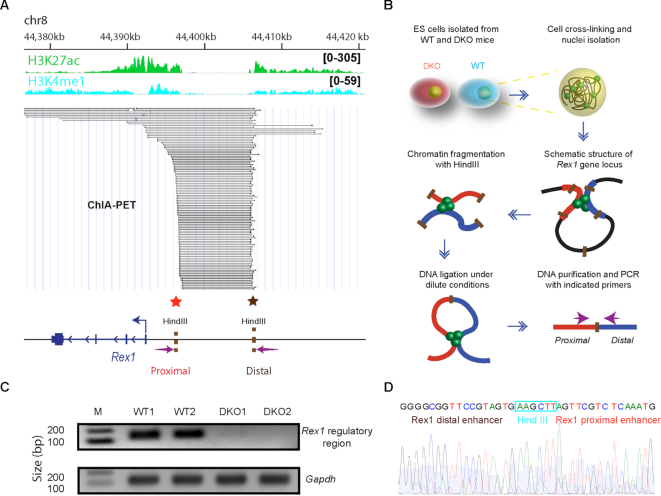
Loss of HMGNs disrupts chromatin interactions at the Rex1 5′ regulatory region. (A) ChIA-PET analysis of interactions between chromatin regulatory regions at the Rex1 locus (data from (33)). Regulatory region and select histone marks are indicated at the top. Each line in the figure indicates a detected interaction between two genomic loci. Below the lines is a genomic outline showing the approximate location of HindIII restriction sites and of the primers (arrows) used in 3C analysis (panel B). (B) Outline of the 3C procedure used to measure chromatin interactions in the 5′ regulatory region of Rex1. (C) DNA fragment resulting from PCR amplification of the 3C library using the primers located in the 5′ regulator region of Rex1 (see arrows in panel A). The absence of signal in DKO cells indicates loss of chromatin interaction. Gapdh primers are used as loading controls. (D) Sanger sequencing confirms that the PCR products correspond to the junction of the two regions located near the regulatory sites in the 5′ region of Rex1.

