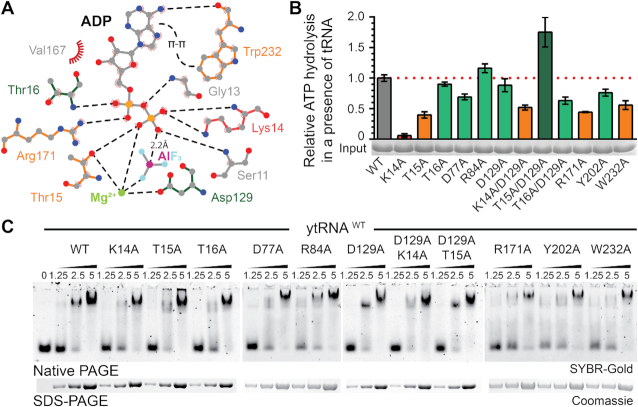
Figure 3.
Mutational analysis of the nucleotide binding pocket in CtKti12. (A) Two dimensional LigPlot (92) overview of the nucleotide binding pocket and residues targeted for mutations. Mutants with abolished (K14A, red), decreased (orange) or normal (green) ATPase activity are highlighted. Potential hydrogen bonds are shown as black dashed lines. Additionally, π-π stacking between adenine and W232 and a distance between the oxygen of phosphate beta and aluminum is shown. (B) ATP hydrolysis by wild type and mutant forms of CtKti12 in response to tRNASec showing the calculated standard deviations (n = 3). Mutants are labeled as in (A) and the upregulated combined mutant is shown in dark green. (C) Analysis of tRNA binding properties in selected nucleotide binding pocket mutants by EMSA. Increasing concentrations of protein (1.25, 2.5 and 5 μM) were incubated with 0.22 μM yeast bulk tRNA and resolved on a 5% native PAGE. tRNA was stained using SYBR-Gold. As a loading control, samples were also analyzed by denaturing SDS-PAGE and stained with Coomassie (lower panel).

