Figure 4.
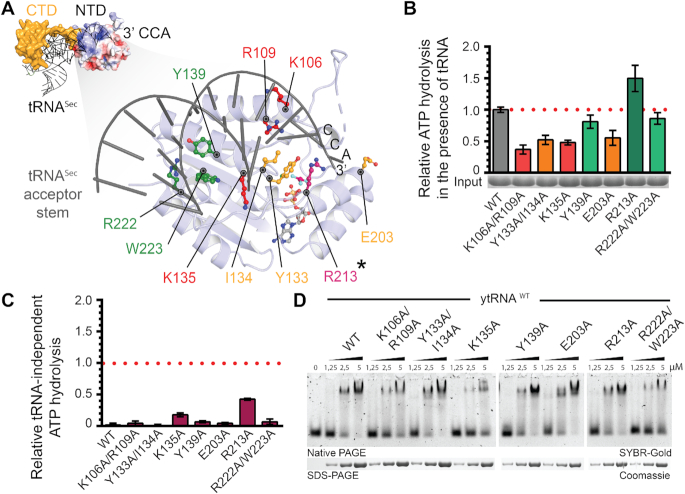
Analysis of tRNASec interaction with CtKti12NTD. (A) (Top left): Structural model of tRNA-bound CtKti12NTD based on superimposition with MjPSTKNTD (3ADB), r.m.s.d. = 3.8 Å2. tRNASec is shown in grey and MjPSTKCTD in yellow. The 3′ end of the superimposed tRNASec reaches to the active site of CtKti12NTD. Surface charge distribution of CtKti12NTD is shown in blue and red. Positively charged regions (blue) coincide with a modelled contact surface with tRNASec. Color coding and scale are identical to Figure S5. (Bottom right): The close up of the model shows the proposed tRNA interaction surface at the NTD, which is shown in light blue, acceptor stem of tRNASec is gray. Mutants with significantly downregulated ATPase activity are shown in red, mutants with moderate ATPase properties in orange. Hydrolytic activity after mutating residues shown in green does not differ significantly from WT protein. The gatekeeping R213 residue (asterisk) is shown in violet. (B) Analyses of hydrolytic properties of tRNA interaction surface mutants using the malachite green assay. Calculated standard deviations are shown (n = 3). Color coding as in (A). (C) tRNA-independent ATP hydrolysis of mutants within tRNA-interaction interface on the NTD using the malachite green assay. The results were normalized to the tRNASec-induced hydrolysis of WT protein and calculated standard deviations are shown (n = 3). (D) Binding affinity of tRNA-interface mutants to the bulk yeast tRNA. Samples were resolved on a 5% native PAGE. As a loading control, samples were also analyzed by denaturing SDS-PAGE stained with Coomassie. tRNA was stained using SYBR-Gold.

