Fig. 3.
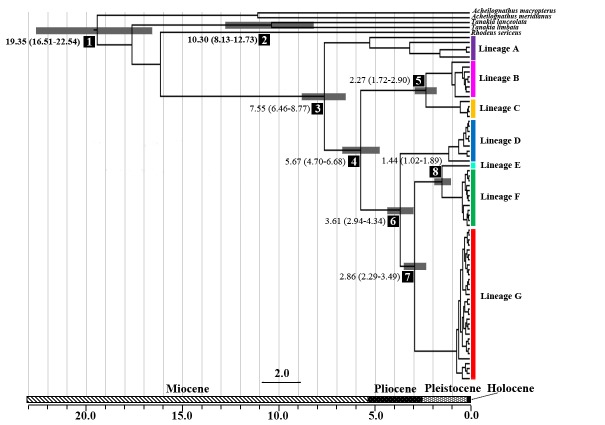
Fig. 3. The divergence times (million years ago) of Rhodeus ocellatus in East Asia. The results estimated by 1.05% per site per million years of the evolutionary rate are shown at the main nodes with the 95% highest posterior densities (HPD) intervals in the parenthesis. The ranges of 95% HPD intervals are represented by the gray bars. Numbers in reverse color at main nodes correspond to Additional file 3. The spatial distributions of the lineages are represented in figure 1 with the same color usage.

