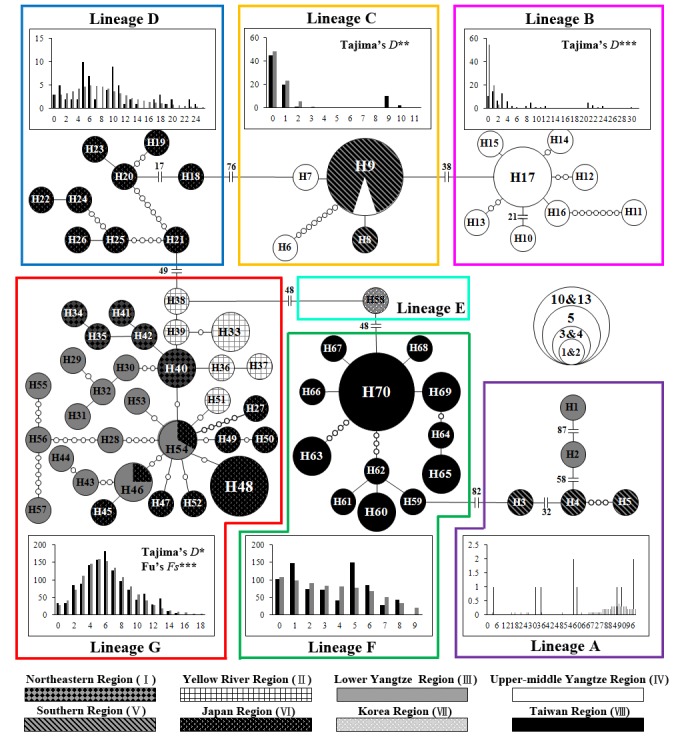
Fig. 4.

Fig. 4. Minimum spanning network and mismatch distribution from cyt b DNA sequences of Rhodeus ocellatus in each lineage. The colors correspond to the lineage in figure 2. The size of each circle represents the number of specimens of each haplotype. The small, open circle between different haplotypes represents the number of mutations. The number of mutations > 8 is shown as the mutation number beside the traverse lines. The results of mismatch distribution are shown in the histograms. The abscissa and ordinate of the histograms indicate the number of pairwise difference between specimens and the frequency of each value, respectively. The black and gray bars represent the frequency distribution of the observed and expected pairwise difference respectively under the sudden expansion model.
