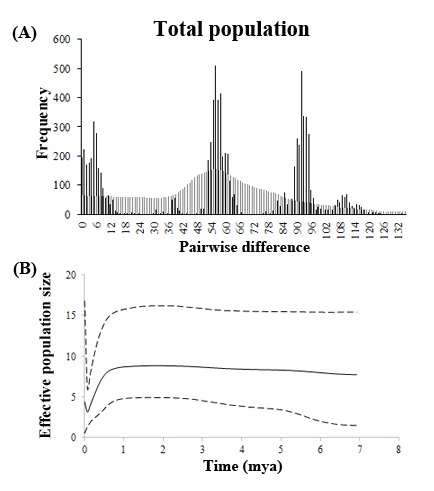
Fig. 5.

Fig. 5. Demographic inference from cyt b sequences of Rhodeus ocellatus in East Asia. (A) Mismatch distribution of total population. The abscissa and ordinate of the histograms indicate the number of pairwise difference between specimens and the frequency of each value, respectively. The black and gray bars represent the frequency distribution of the observed and expected pairwise difference respectively under the sudden expansion model. (B) Bayesian skyline plot (BSP) of total population estimated by 1.05% per site per million year of evolutionary rate. The black line indicates the mean curve of BSP. The dotted line indicates the 95% highest posterior density intervals of the BSP. The x-axis indicates the time (million years ago, mya). The y-axis is the estimated effective population size.
