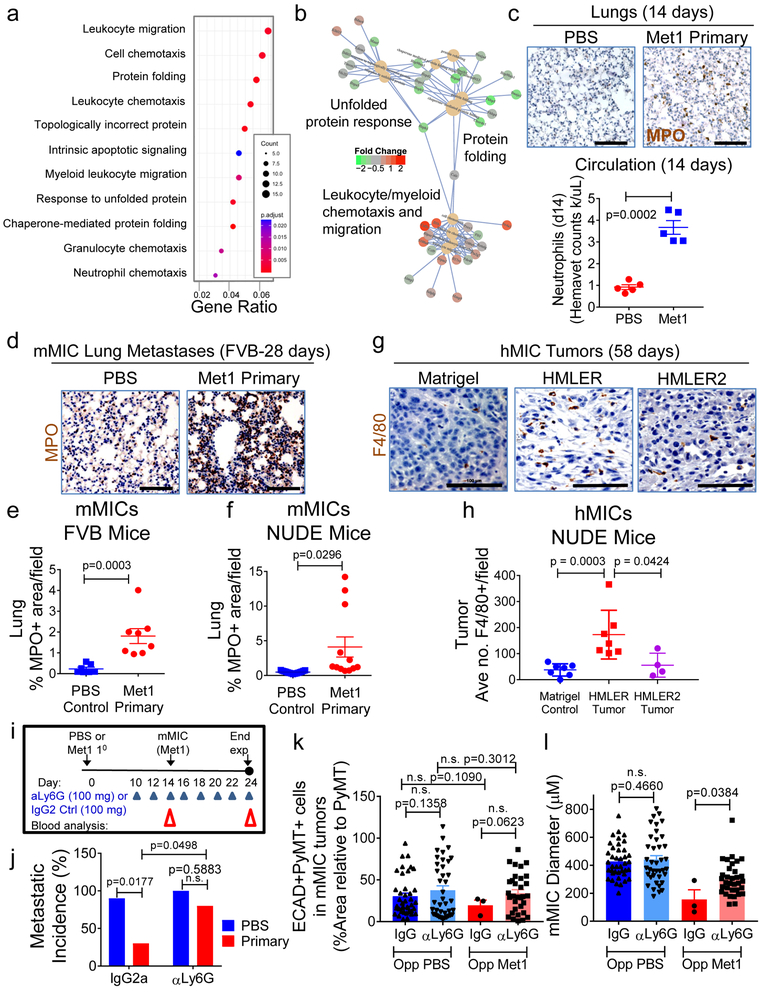
Figure 3. Myeloid cells are necessary for preventing MIC differentiation and outgrowth.
a, Gene ontology (GO) terms found in differentially expressed genes (DEG; DESeq2 adjusted p-value<0.05) between normal or Met 1primary tumour-bearing lungs (n=4 mice/cohort). Y-axis: top 11 enriched (padj<0.01) categories, low (red), high (blue) adjusted p-value; dot size: number of DEGs within GO term; X-axis: ratio of DEGs to total gene number within GO term. b, Connectivity map of top 10 enriched GO terms and DEGs within them. GO term nodes (beige), fold-change (red, up; green, down) between Met1 primary tumor-bearing and control lungs. c, Images: pulmonary neutrophils (myeloperoxidase, MPO; brown) at day 14 from FVB mice bearing Met1 tumor or PBS control. Hematoxylin (nuclei, blue). Graph: circulating neutrophil counts/microliter blood (hemavet). d, Pulmonary neutrophils (MPO; brown) at day 28 from FVB mice bearing PBS control or orthotopic Met1 primary tumors. Hematoxylin (nuclei, blue). e, f, Quantification of pulmonary neutrophils from FVB mice: Control cohort n=21 independent images representing 7 lungs; Met1 primary tumor cohort n=24 independent images representing 8 lungs (e); or Nude mice: Control n=15 independent images representing 5 lungs; Met1 primary cohort n=12 independent images representing 4 lungs (f). g, h Representative immunohistochemistry (g) and corresponding quantification (h) of hMIC tumors grown opposite Matrigel, HMLER, or HMLER2 tumors (per Fig. 1h). Tissues stained with F4/80 (macrophages, brown); hematoxylin (nuclei, blue). Control n=28 independent images representing 7 tumors; HMLER n=24 independent images representing 7 tumors; HMLER2 n=16 independent images representing 4 tumors. (i) Schematic of neutrophil depletion experiments using 100 μg either anti-Ly6G or IgG control. j, Macroscopic pulmonary metastasis incidence (control IgG2a n=4 mice/cohort; anti-Ly6G n=8 mice/cohort). k, ECAD+/PyMT+ staining (% total PyMT+ area) in mMIC lung metastases. l, average mMIC lung metastasis size. mMIC opposite Control PBS: anti-IgG2a n=40 independent images representing 4 mice; anti-Ly6G n=39 independent images representing 4 mice. mMIC opposite Met1 primary tumor: anti-IgG2a n=3 independent images representing 5 mice; anti-Ly6G n=33 independent images representing 4 mice. Scale bars=100 μm. Source data for c, e, f, h, j, k, l in Supplementary Table 1. 1-sided Welch’s t test (c, k); 2sided Welch’s t test (f); 1-sided Mann-Whitney test (h, l); 2-sided Mann-Whitney test (e); 2way- ANOVA with Sidak’s multiple comparison test (j).

