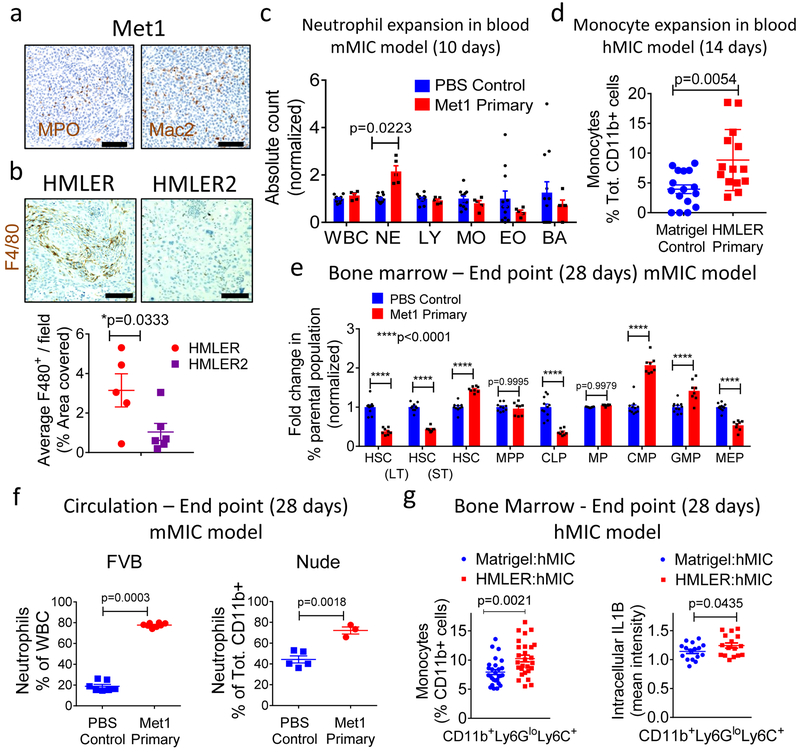
Figure 6. Primary tumors initiate a sustained systemic inflammatory response.
a-b, Met1 primary tumors (Fig. 1a schematic) stained for myeloperoxidase (MPO; brown) to detect neutrophils, Mac2 to detect macrophages (Mac2; brown); hematoxylin (nuclei, blue) (a). HMLER and HMLER2 tumors (Fig. 1h schematic) stained for F4/80 (macrophages, brown) and Hematoxylin (nuclei, blue); quantified in adjacent graph (HMLER n=5 tumors; HMLER2 n=6 tumors) (b). Scale bars=100 μm. c, Absolute blood counts (hemavet) in circulation (FVB mice) 10 days after orthotopic injection of Met1 primary tumors (n=5 animals) or PBS control (n=12 animals). WBC, Whole blood cells; NE, neutrophils; LY, lymphocytes; MO, monocytes; EO, eosinophils; BA, basophils. d, Flow cytometric analysis of circulating monocytes (CD11b+Ly6ChiLy6Glo), Nude mice, 14 days after injection of Matrigel control (n=16 independent images representing 8 tumors) or HMLER primary tumors (n=14 independent images representing 7 tumors), representing 2 independent experiments. e, Fold changes (% parental population) in bone marrow of FVB mice bearing orthotopic Met1 primary tumors (n=8 animals) or PBS control (n=10 annimals) after 28 days. HSC, hematopoietic stem cells; LT-HSC, long-term hematopoietic stem cells; ST-HSC, short term hematopoietic stem cells; MPP, multipotent progenitors; CLP, common lymphoid progenitors; MP, myeloid progenitors, CMP, common myeloid progenitors; GMP, granulocyte-monocyte progenitors; MEP, megakaryocyte/erythroid progenitors. f, Quantification of circulating neutrophils (CD11b+Ly6G+Ly6Clo) at 4-week experimental end points from indicated strains of mice bearing mMIC lung metastases with concurrent orthotopic Met1 primary tumors or PBS control. (FVB mice: Control n=7 animals; Met1 primary n=8 animals); Nude mice: Control n=5 animals; Met1 primary n=3 animals). Representative of 3 (FVB) and 1 (Nude) experiments. g, Monocytes (CD11b+Ly6ChiLy6Glo, n=27 samples/cohort representing 11 tumors, 3 independent experiments) as % total CD11b+ cells in the bone marrow of Nude mice bearing hMIC tumors grown opposite Matrigel control or HMLER primary tumors after 28 days (left). Intracellular IL-1β in bone marrow monocytes (n=16 samples/cohort, representing 8 tumors, 2 independent experiments) (right). Source data for b, c, d, e, f, g provided in Supplementary Table 1. 1-sided Welch’s t test (b, g-right); 2-sided Welch’s t test (d, f-right, g -left); 2-way ANOVA Tukey’s multiple comparison test (c, e); 2-sided Mann-Whitney test (f-left).

