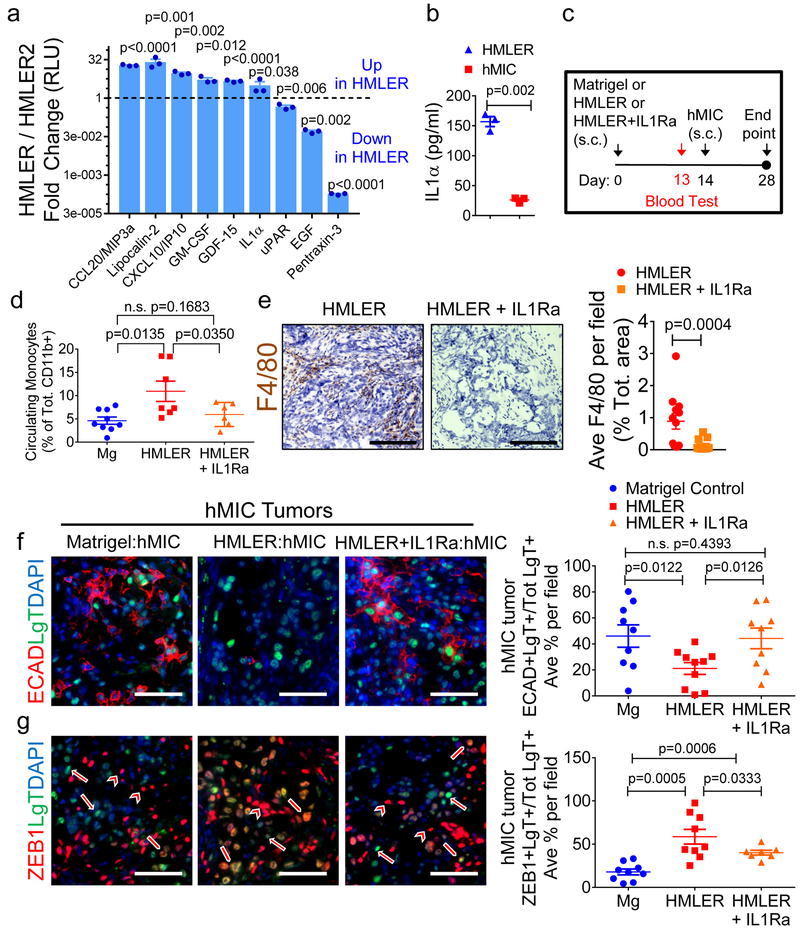
Figure 7. Inhibiting inflammation at primary tumor site results in differentiation of disseminated MICs.
a, Inflammatory cytokine array analysis of conditioned media from HMLER and the non-inhibitory primary tumor, HMLER2 cells, 3 days in culture (n=2 biological replicates, 3 technical replicates each). Results are fold change (Log2) HMLER/HMLER2. b, ELISA for IL-1α in conditioned media from HMLER and hMIC cells, 3 days in culture (n=3 biological replicates, 5 technical replicates each). c, Experimental schematic modeling early stages of hMIC colonization (Nude mice) with Matrigel control, HMLER primary tumor, or HMLER primary tumor + IL-1Ra. d, Flow cytometric analysis of CD11b+Ly6C+Ly6Glo circulating monocytes (day 13), prior to contralateral injection of hMIC cells, in mice bearing Matrigel control (n=9 animals), HMLER tumors (n=7 animals), or HMLER+IL-1Ra (100ng/ml) tumors (n=6 animals).e, Images: HMLER and HMLER+IL-1Ra tumors stained with F4/80 (macrophage, brown) and hematoxylin (nuclei, blue). Scale bars=100 μm. Graph: area positively stained for F4/80+ macrophages in HMLER and HMLER+IL-1Ra tumors (n=12 independent images representing 4 tumors/cohort). f, g, Images: Indicated immunohistochemical staining of various hMIC tumors. Arrows: ZEB1-negative tumor cells; block arrows: ZEB1+ tumor cells; arrowheads: ZEB1+ stromal cells; scale bars=100 μm. Graphs: Quantification of ECAD+LgT+ cells in hMIC tumors opposite Matrigel (n=9 independent images), HMLER (n=10 independent images), HMLER+IL-1Ra (n=9 independent images), 3 tumors/cohort (f) or ZEB1+LgT+ cells in hMICs tumors opposite Matrigel (n=9 independent mages), HMLER (n=9 independent images), HMLER+IL-1R (n=7 independent images) 3 tumors/cohort) (g) as % of total number of LgT+ human tumor cells/microscopic field. Source data for a, b, d, e, f, g provided in Supplementary Table 1. Multiple 2-sided t tests (a); 2-sided Welch’s t test (b); 1-sided Welch’s t test (d, f, g); 2-sided Mann-Whitney test (e).

