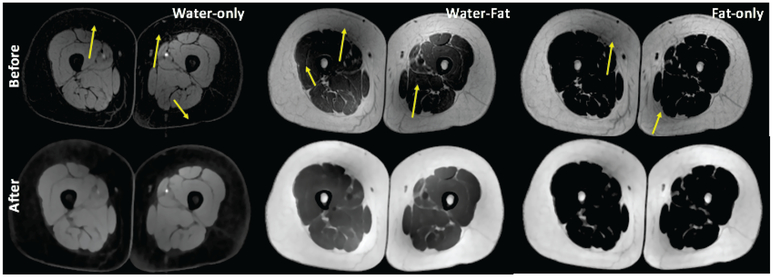
Fig. 3:
First row includes water-only, water-fat, and fat-only MR images with inherent noise and bias-field (marked with yellow arrows). The second row shows cleaned MRI correspondences after the preprocessing steps: inhomogeneity correction, denoising, and intensity standardization. We trained standardization parameters (i.e., histogram landmarks) separately for different image modality.

