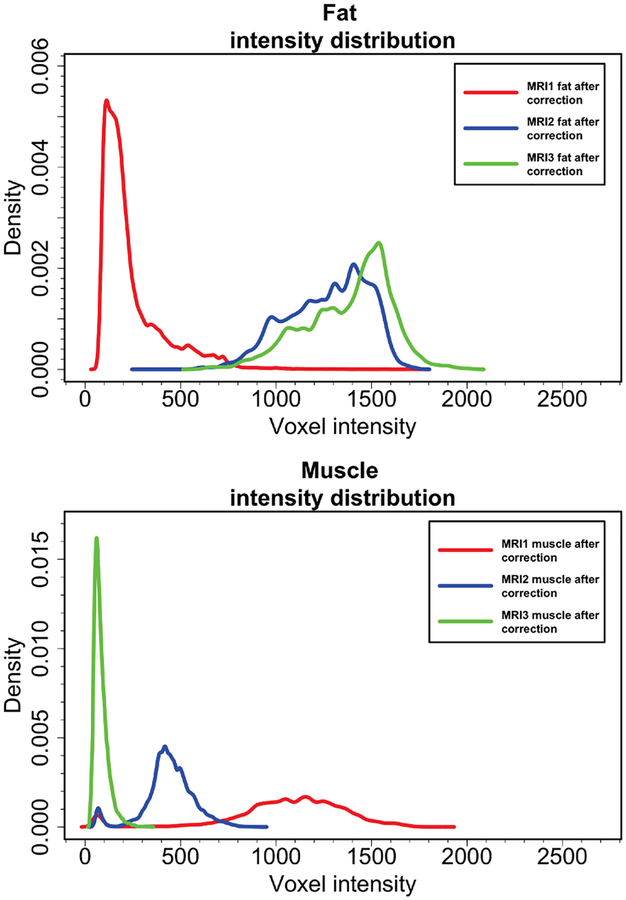
Fig. 4:
Probability density estimations of fat and muscle intensities in water-only (MRI1), water-fat (MRI2), and fat-only (MRI3) images are shown. All images in the dataset (N=150) were used for this analysis. In the first row, although water-fat and fat-only have similar variances, the intensity distribution in water-only is quite different from the other two. In the second row, water-only, water-fat and fat-only have different distributions with different variances. Complementary information is noted therein, with water-fat contrast is better suited for Gaussian modeling, which is highly desirable in many statistical analysis settings.

