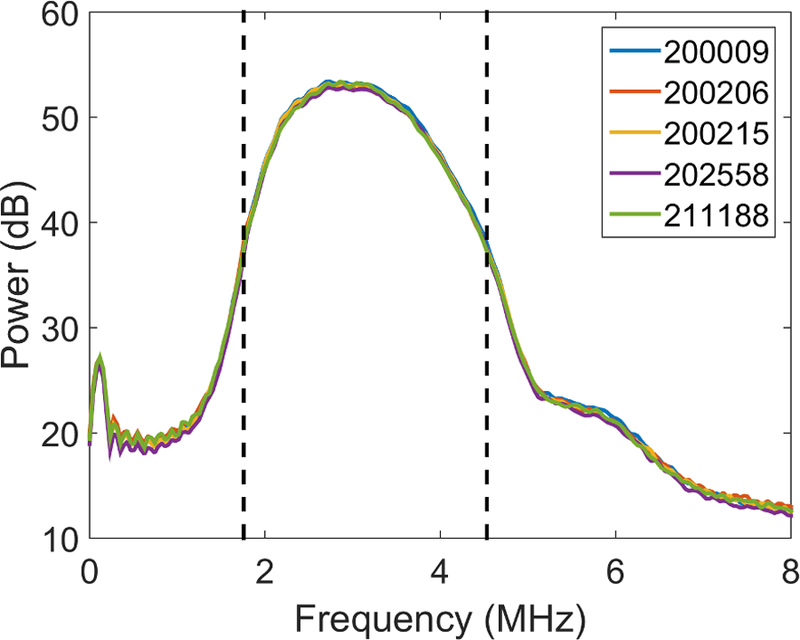
Figure 2.

The power spectrum estimates for a 6C1 transducer (S/N: 12500152) and each of five Acuson S3000 systems using 750 uncorrelated A-lines. The dashed vertical lines represent the analysis bandwidth that is +10 dB above the noise floor (1.5–4.9 MHz).
