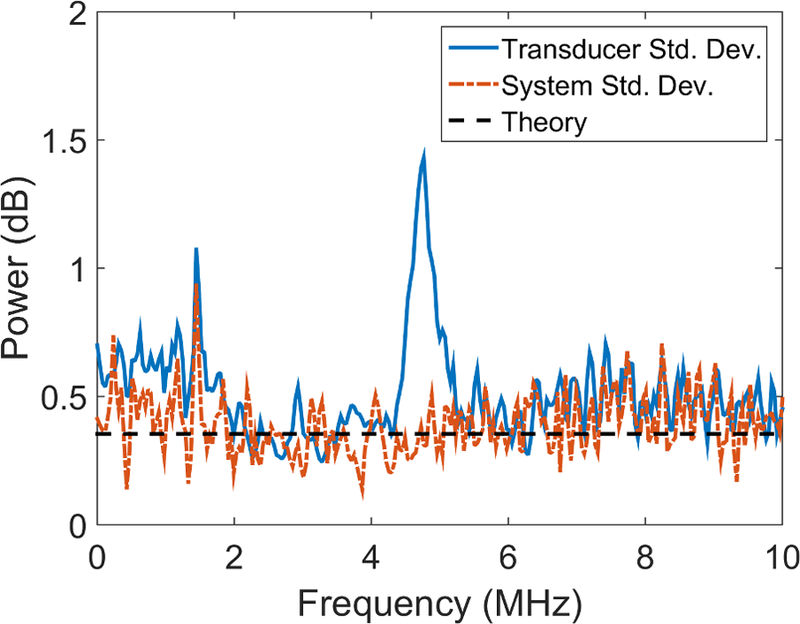
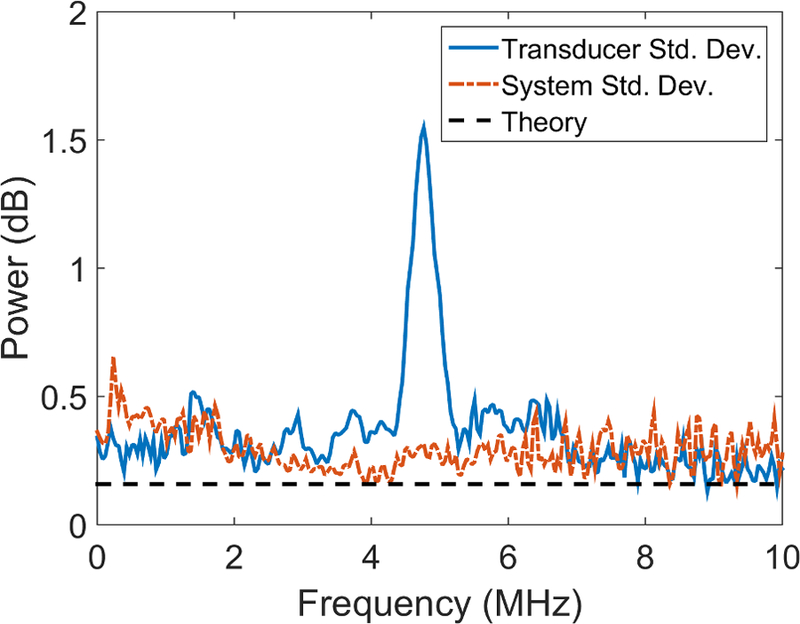
Figure 3.


Variance of power spectrum estimates among eleven 6C1 transducers (solid line; Eq. (6)), five Acuson S3000 systems (dash-dot line; Eq. (5)), and the theoretical speckle variance (horizontal dashed line; ) obtained with (a) 150 uncorrelated A-lines and (b) 750 uncorrelated A-lines. The peaks cut off near 5 MHz reach a height of: (a) 2.05 dB2 and (b) 2.40 dB2 respectively. The peak cut off near 1.4 MHz reaches a height of: (a) 1.16 dB2.
