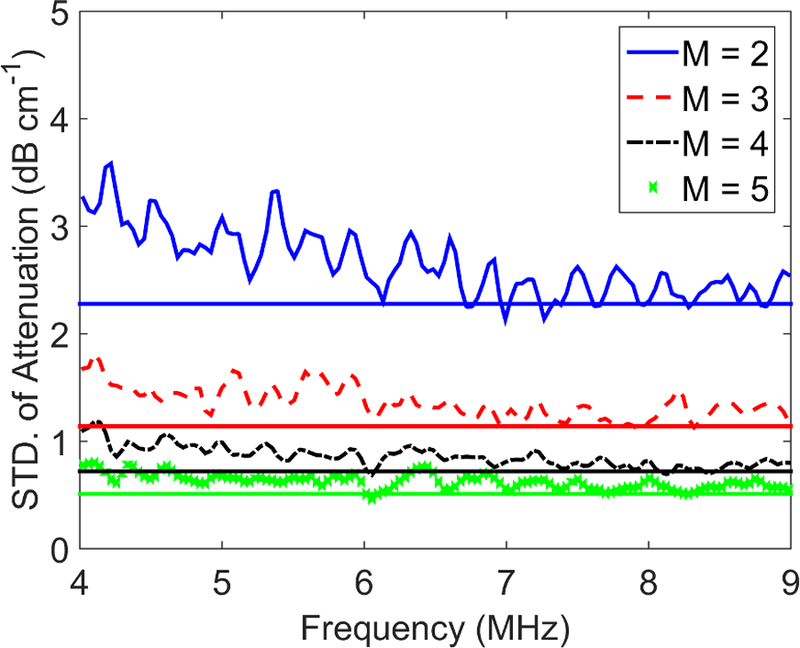
Figure 8.

Estimated versus predicted values of the standard deviation of attenuation coefficient estimates as a function of frequency for M=2–5 independent ratios of sample to reference phantom power spectra used in attenuation coefficient estimation. Solid horizontal lines represent values predicted using Eq. B.9 in Appendix B.
