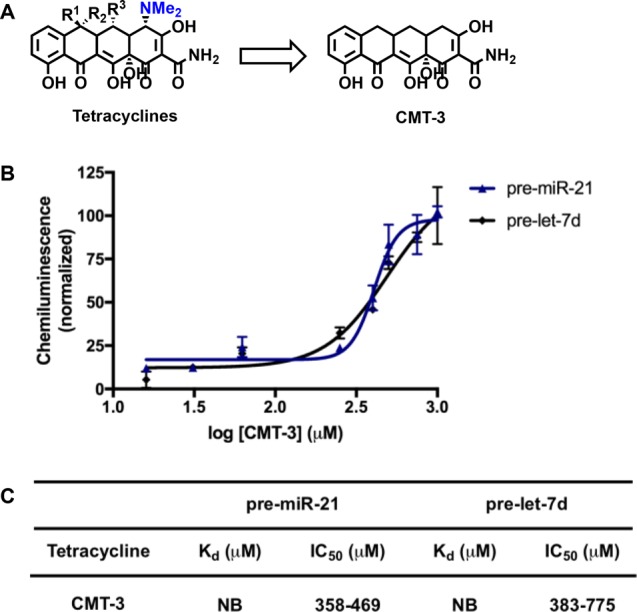
Figure 5.

CMT-3. (A) Structure of CMT-3 in comparison to the tetracycline scaffold. (B) Plot of dose-dependent inhibition by CMT-3. (C) Table of binding affinities and inhibition constants (NB = no binding). The IC50 values are represented as 95% confidence intervals.
