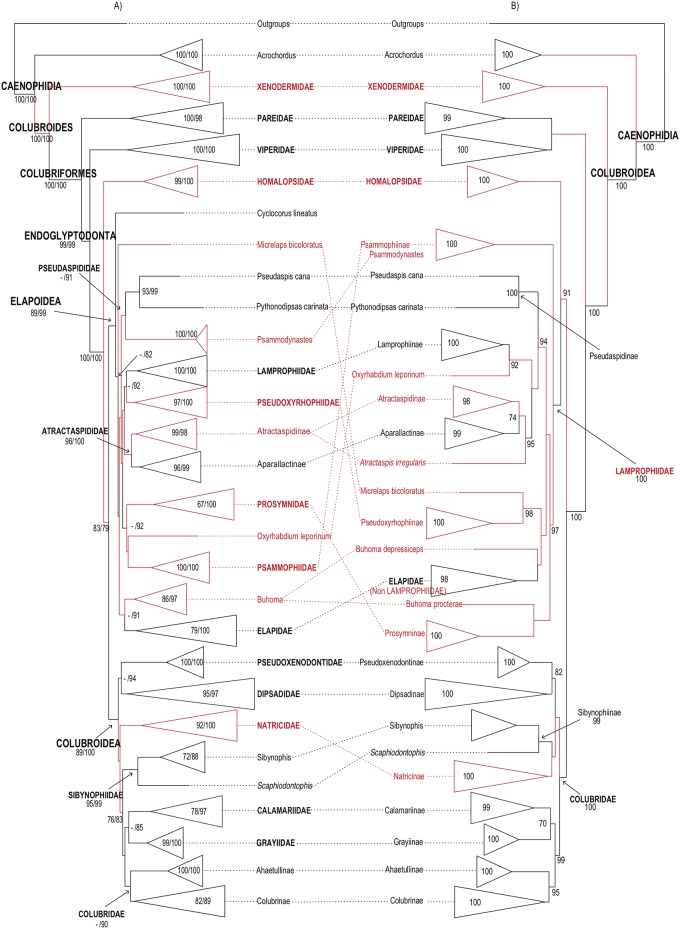
Fig 1. Higher-level caenophidian phylogenies.
Comparison between Maximum-likelihood phylogenetic estimates from (A) the present study and (B) Figueroa et al. [28]. Tips represent commonly recognized families, subfamilies and rogue taxa. Names in red correspond to taxa with distinct phylogenetic positions in the topologies compared. Numbers on each branch and within expanded tips correspond to our and previously reported support values: (A) FBP (left) and SHL (right); (B) FBP. Branches without numbers have support <70%.

