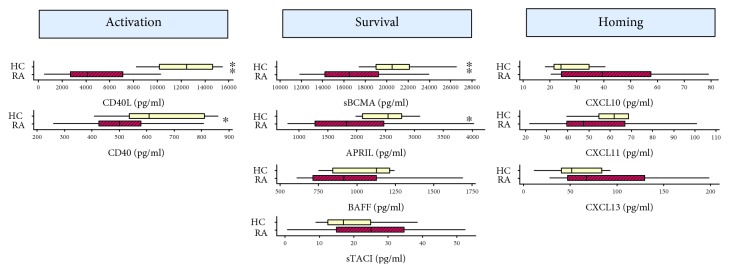
Figure 2.
Box plots comparing serum B-cell factor protein levels in RA patients and healthy controls. Levels of each protein are indicated for healthy controls (HC, top yellow box; n = 10) and RA patients (RA, bottom red box; n = 23). The median value is indicated with a vertical line, with the box comprising the IQR, and whiskers representing the maximum and minimum values within the fences (±1.5 IQR). ∗∗ p < 0.01 and ∗ p < 0.05. Serum levels of B-cell activation factors (CD40, CD40L) and B-cell/ASC survival elements (sBCMA, APRIL) were significantly decreased in RA patients compared with healthy controls.

