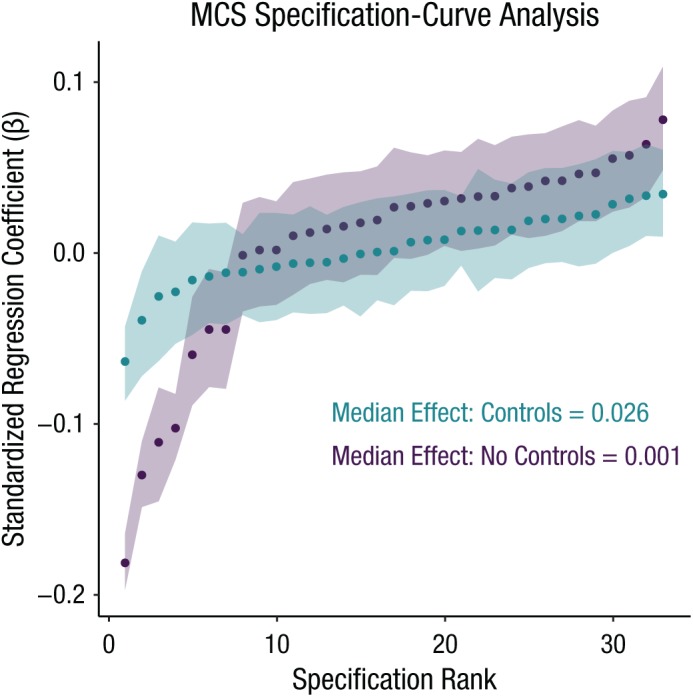
Fig. 2.

Results of the specification-curve analysis for the Millennium Cohort Study (MCS) data set. The plot shows the standardized regression coefficients of the linear regressions linking digital engagement and adolescent well-being. The two different curves represent specifications with (teal) and without (purple) control variables. The shaded areas indicate the 95% confidence intervals calculated using bootstrapping.
