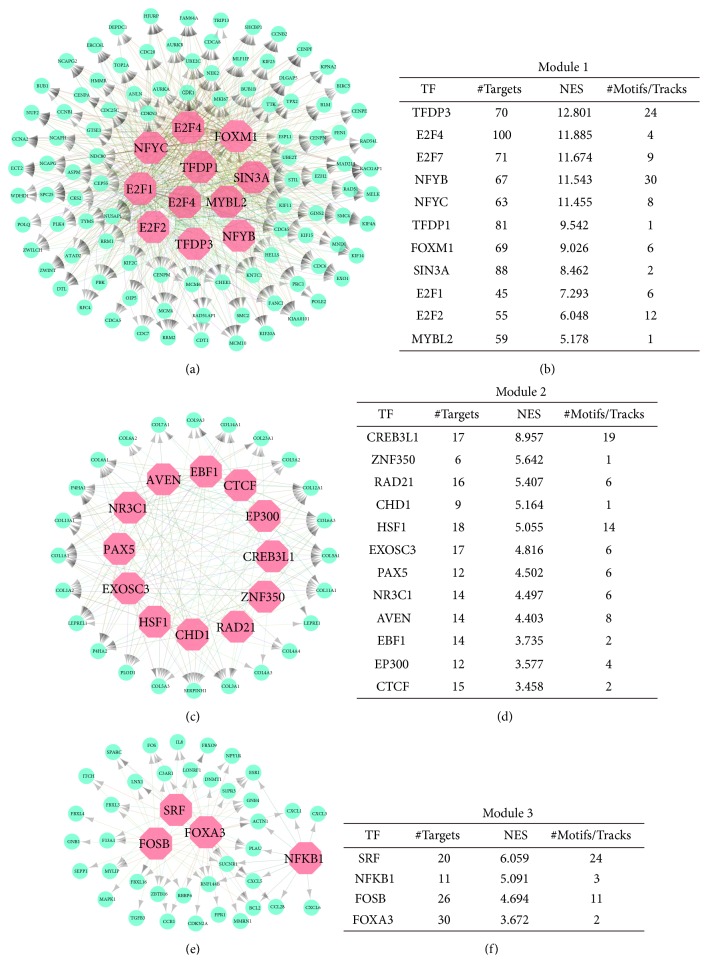
Figure 5.
Identification of master regulators in regulatory network of ATC. (a, c, e) Results of the regulatory analysis with iRegulon for three key modules. The cyan nodes represented regulated targets. The light red nodes indicated transcription factors. (b, d, f) Lists of TFs that targeted the genes in three modules. TFs, transcription factors; NES, normalized enrichment score.

